Abstract
Objective:
We aim to demonstrate the in vivo capability of a wearable sensor technology to detect localized perturbations of sensory-evoked brain activity.
Methods:
Cortical somatosensory evoked potentials (SSEPs) were recorded in mice via wearable, flexible epidermal electrode arrays. We then utilized the sensors to explore the effects of transcranial focused ultrasound, which non-invasively induced neural perturbation. SSEPs recorded with flexible epidermal sensors were quantified and benchmarked against those recorded with invasive epidural electrodes.
Results:
We found that cortical SSEPs recorded by flexible epidermal sensors were stimulus frequency dependent. Immediately following controlled, focal ultrasound perturbation, the sensors detected significant SSEP modulation, which consisted of dynamic amplitude decreases and altered stimulus-frequency dependence. These modifications were also dependent on the ultrasound perturbation dosage. The effects were consistent with those recorded with invasive electrodes, albeit with roughly one order of magnitude lower signal-to-noise ratio.
Conclusion:
We found that flexible epidermal sensors reported multiple SSEP parameters that were sensitive to focused ultrasound. This work therefore 1) establishes that epidermal electrodes are appropriate for monitoring the integrity of major CNS functionalities through SSEP; and 2) lever-aged this technology to explore ultrasound-induced neuromodulation. The sensor technology is well suited for this application because the sensor electrical properties are uninfluenced by direct exposure to ultrasound irradiation.
Significance:
The sensors and experimental paradigm we present involve standard, safe clinical neurological assessment methods and are thus applicable to a wide range of future translational studies in humans with any manner of health condition.
Keywords: Animal models, biomedical electrodes, biomarkers, flexible electronics, focused ultrasound, somatosensory evoked potentials
I. Introduction
SENSORY stimuli evoke excitatory electrical potentials that ascend and are filtered at discrete processing areas as the volley of information is communicated to the cerebral cortex. This transmission process can be altered by a multitude of factors including brain health, emotion, motivation, or through neuromodulation technologies. Because sensory-evoked brain activity is highly stereotyped, subtle alterations can report on the status and integrity of the central nervous system. SSEPs are routinely probed in clinical settings, particularly as part of intraoperative neurophysiological monitoring, to detect, confirm and localize neural impairment or lesion and to monitor functional recovery [1]–[4].
While real-time monitoring of these signals provides critical information regarding neurological health, current wearable devices are typically cumbersome. Flexible epidermal electronics [5], however, offer the potential for monitoring with a negligible level of user interface burden, providing new opportunities for real-time neurological monitoring in clinical and home use environments. This new class of flexible electronics conforms to the skin and can be applied in the same fashion as a “temporary tattoo.” Various form factors, designs and applications have been proposed, including ear-mounted electroencephalographic (EEG) sensors for brain-computer interfaces [6], muscle stimulation and force sensing electronics for prosthetic control and posture assessment [7], tactile sensing gloves [8], gesture sensors for remote device control [9], as well as adhesive systems for controlled delivery of therapeutic agents and heat [10]. The ease with which they can be applied, for instance via adhesives in which electronic components are embedded, also makes them attractive for potential use in emergency medical situations because they can be disseminated potentially on large scale at low cost [11]. Furthermore, their mechanical pliability makes them ideal wearables for constant health monitoring for active, at-risk individuals such as athletes or Military Service members. In human experiments, flexible electronics have indeed demonstrated stability for detecting both rapid, sensory related potentials such as P300 [12], mismatched negativity [13], as well as for long-term recording of ongoing EEG signals [14].
We have previously shown that SSEP modulation by focused ultrasound-elicited neural perturbations can be detected by invasive epidural electrodes [15]. Here, we studied the capability of flexible epidermal sensors to detect and monitor such changes in SSEPs due to such targeted perturbation in neural activity. These sensors are well-suited for this application because their form factor minimizes mechanical interference and absorption of energy due to ultrasound irradiation and does not require invasive surgical procedures for implementation.
II. Methods and Materials
A. Flexible Epidermal Electrode Array Fabrication
Fabrication of the conformable electrode arrays followed procedures similar to those previously described in [7]. Briefly, the arrays were fabricated from sputtered gold layers and spin casted polyimide layers (see Fig. 1). The gold layers were 200 nm in thickness and functioned as electrodes; the polyimide layers were 5 μm in thickness and functioned as insulators. A 5-nm chromium layer acted as adhesion for the gold/polyimide interface. Standard micro fabrication processes such as dry/wet etching were applied to produce the “filamentary serpentine,” giving the electrode arrays the capability to stretch and flex while maintaining electrical continuity. Each flexible array was 6.35 mm in length and width, and had nine square gold electrode contacts, each 1.2 mm in length and width [Fig. 1(a) and (d) for scale]. Individual electrodes contained a dedicated and isolated wiring route to the bond pads area by snaking through the multilayer structure, as illustrated in the cross section of the device in Fig. 1(b). Two exposed serpentine surface conductor traces can function as ground electrodes, although they were not used in this study. There were 11 interface conductors in total wired to the bond pads designed for anisotropic conductive film based connection.
Fig. 1.
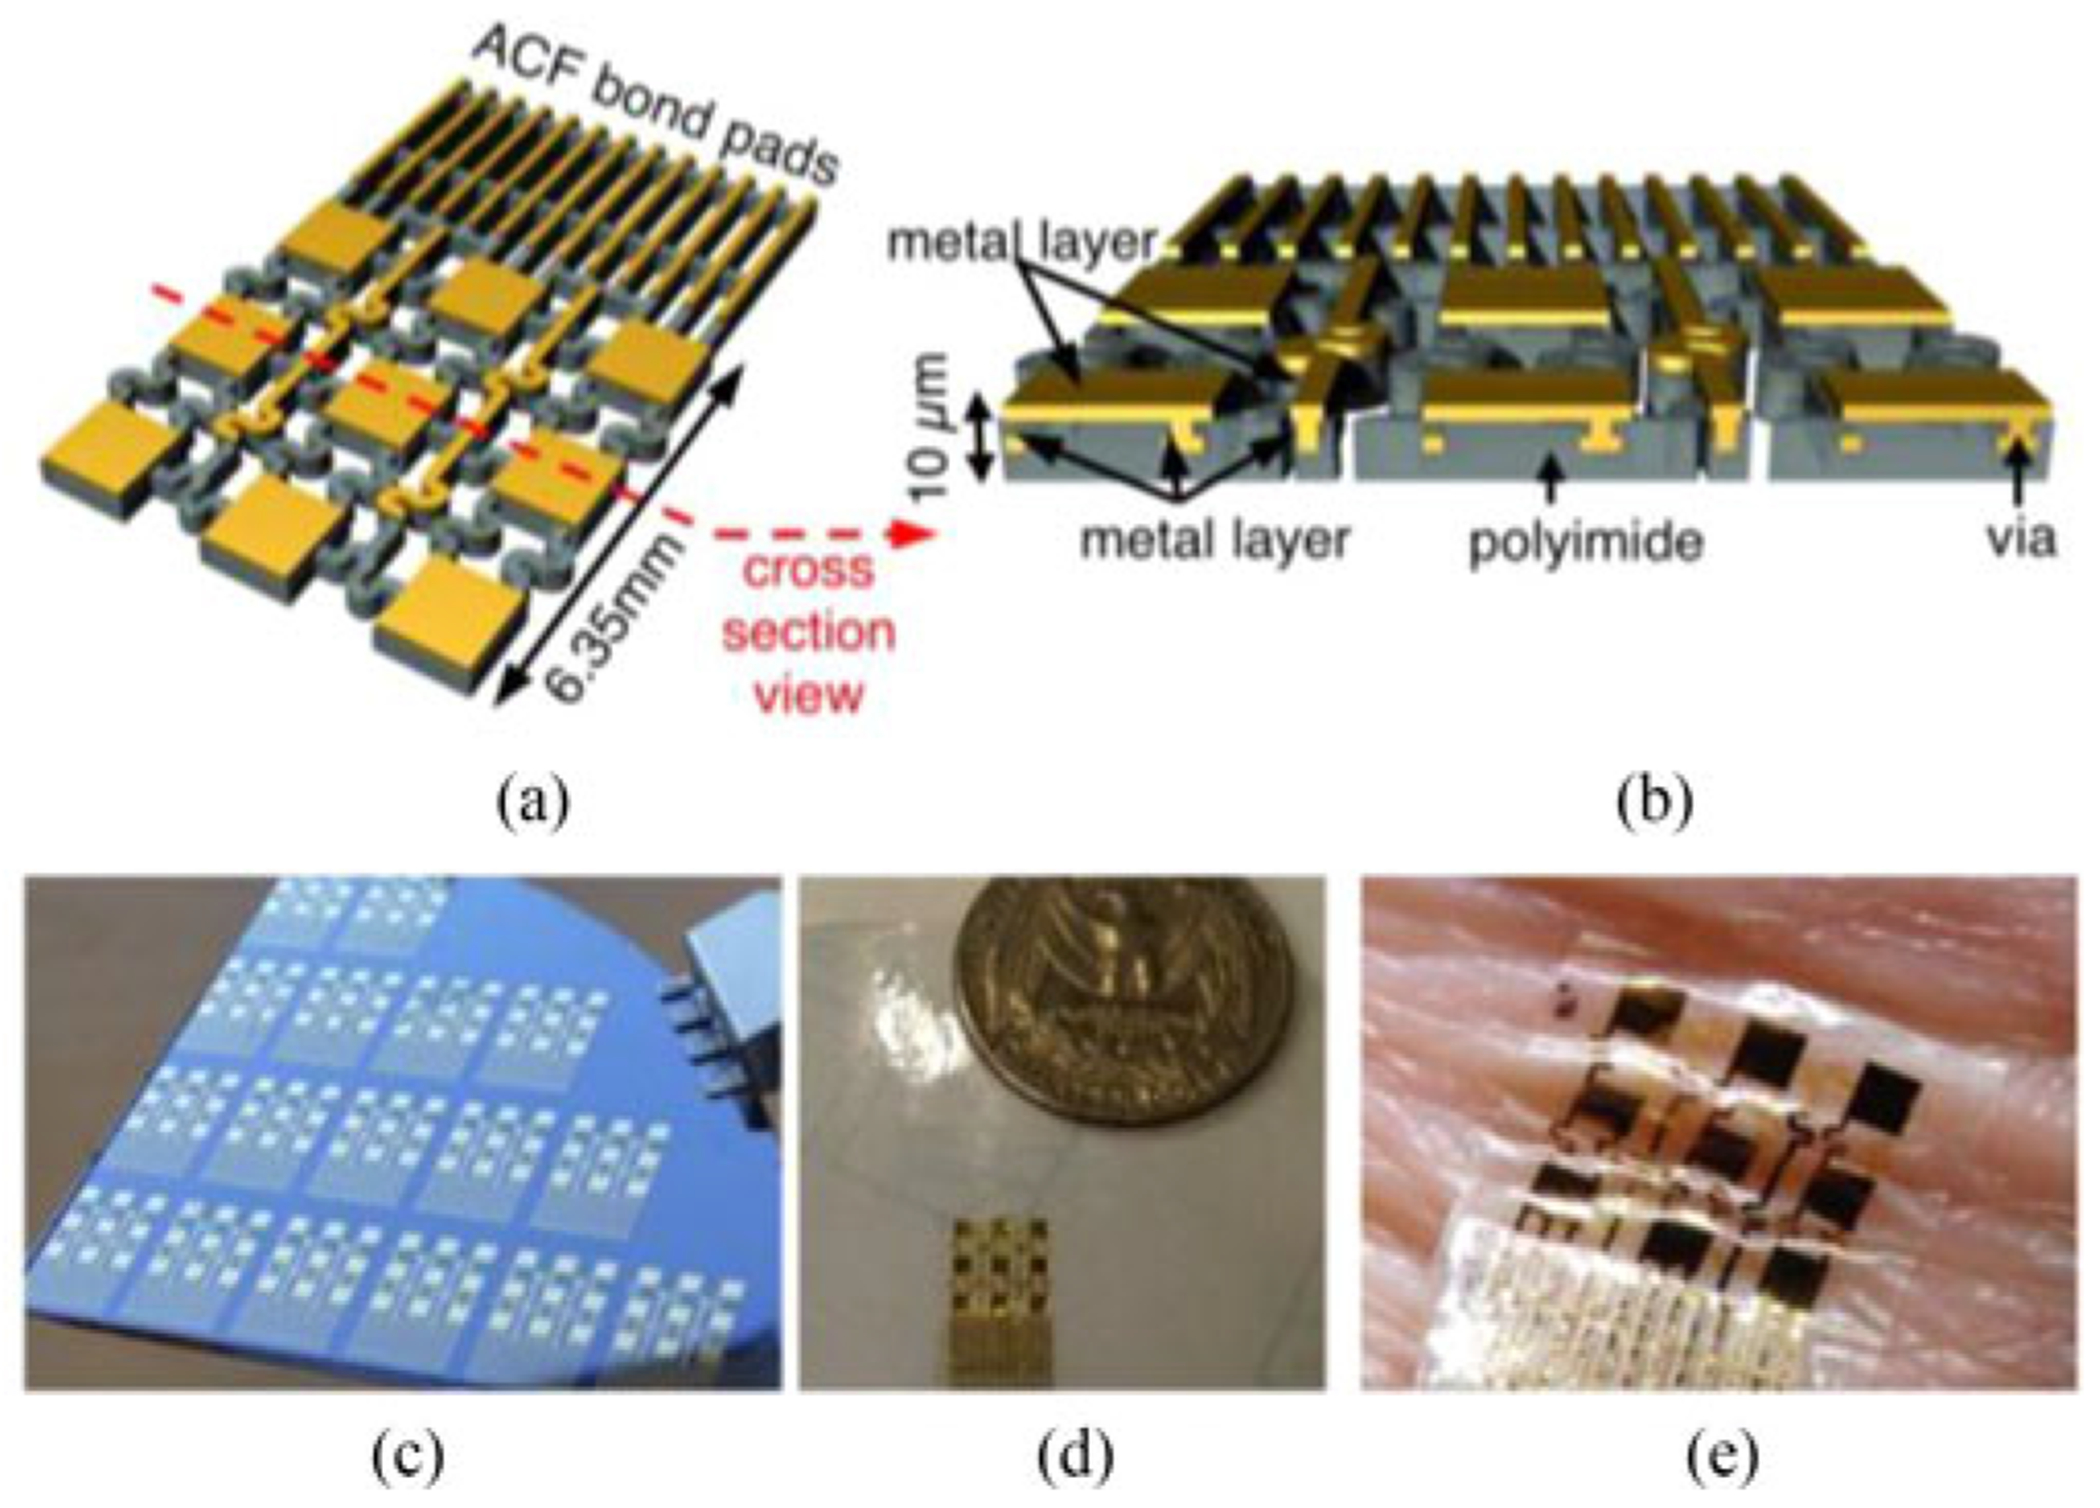
(a) A rendering of a flexible epidermal electrode array. (b) A cross sectional view of the array, showing embedded structures. (c) Multiple flexible epidermal electrode arrays on a silicon wafer during fabrication. (d) A completed array on 3 M Tegaderm medical transparent film dressing. (e) A flexible epidermal array adhered to the skin, demonstrating its conformal properties.
The first metal layer was completely embedded within layers of polyimide and provided insulated wiring of all 11 channels to the bonding pads. Vias connected the first and second metal layers [see Fig. 1(b)]. The overall thickness of the device was approximately 10 μm. Such ultrathin structure, along with the mesh construction, enabled the conformal coverage over the surface of the skin [see Fig. 1(e)]. The impedance magnitude of the flexible electrodes, measured at 1 kHz in situ, was typically between 10 and 30 kΩ.
B. Animal Preparation
All animal experiments were performed in accordance with the guidelines of the White Oak Institutional Animal Care and Use Committee. Adult C57/B6 mice (12–24 weeks) were anesthetized with brief exposure to a high concentration of isoflurane (4%), and maintained at a constant anesthetic state with isoflurane (1–1.5%) throughout the remainder of experimental session, which typically lasted ~5 hours. Anesthetic level was monitored by toe pinch and respiration rate. Each animal’s head was secured in position with a stereotaxic apparatus (David Kopf Instruments). A closed-loop heating pad (CWE, Inc) maintained the animal’s body temperature between 36 and 37 °C.
To apply a flexible epidermal electrode array to the mouse scalp, scalp hair was first removed with a calcium hydroxide and sodium hydroxide paste (Nair, Carter-Wallace) followed by a facial cleanser and repetitive rinsing with water. The scalp was then gently scrubbed with a cotton swab to further cleanse the scalp. A thin layer of conductive paste (Ten20 Conductive Gel, Parker and Company, USA) was applied to the scalp before an electrode array was placed on the scalp. A 1 cm-wide strip of plastic wrap (Saran) was stretched over the electrode array to apply normal pressure to the electrode array to enhance the contact of the electrodes with the skin.
C. Non-contact Perturbation of Brain Function Using Focused Ultrasound
Focused ultrasound was used to non-invasively perturb the frontal lobe in order to spatially accommodate the recording array (see Fig. 2). The delivery of energy with focused ultrasound is “non-contact,” in that flexible epidermal sensors (or other electronics) may be placed in the area beneath the transducer (albeit in the presence of sonogram gel). This fluid gap introduces only minimal mechanical coupling and reduces interruptions due to manipulation and surgical procedures. The sonication location relative to the flexible electrode array is illustrated in Fig. 2(b). The perturbation target was approximately 2 mm anterior and 1.5 mm lateral to Bregma. A ring-geometry ultrasound transducer (H102, Sonic Concepts, Bothell, WA) was housed in a water-filled nosecone, capped by a tensile plastic membrane. The nosecone tip was then placed a fixed working distance, 2 to 3 mm, above the skin, to which it was acoustically coupled with sonogram gel. The ultrasound beam focus is approximately 1 mm laterally and 3 mm axially. The ultrasound dose consisted of a pulse train of 1.1 MHz sinusoidal pulses, each of duration of 10 ms, followed by an off time of 200 ms; 4 animals were exposed to 40 pulses, 5 animals to 100 pulses, and 5 animals to 300 pulses. The peak-to-peak driving voltage was approximately 450 V, yielding approximately 19 MPa peak positive pressure and 4 MPa peak negative at the focus. In sham experiments, the ultrasound transducer was positioned on the animal’s head but the RF amplifier remained switched off. This permitted us to assess any unintentional electrical or mechanical artifacts or coupling that happened to occur as a result of the external triggering of the ultrasound apparatus.
Fig. 2.
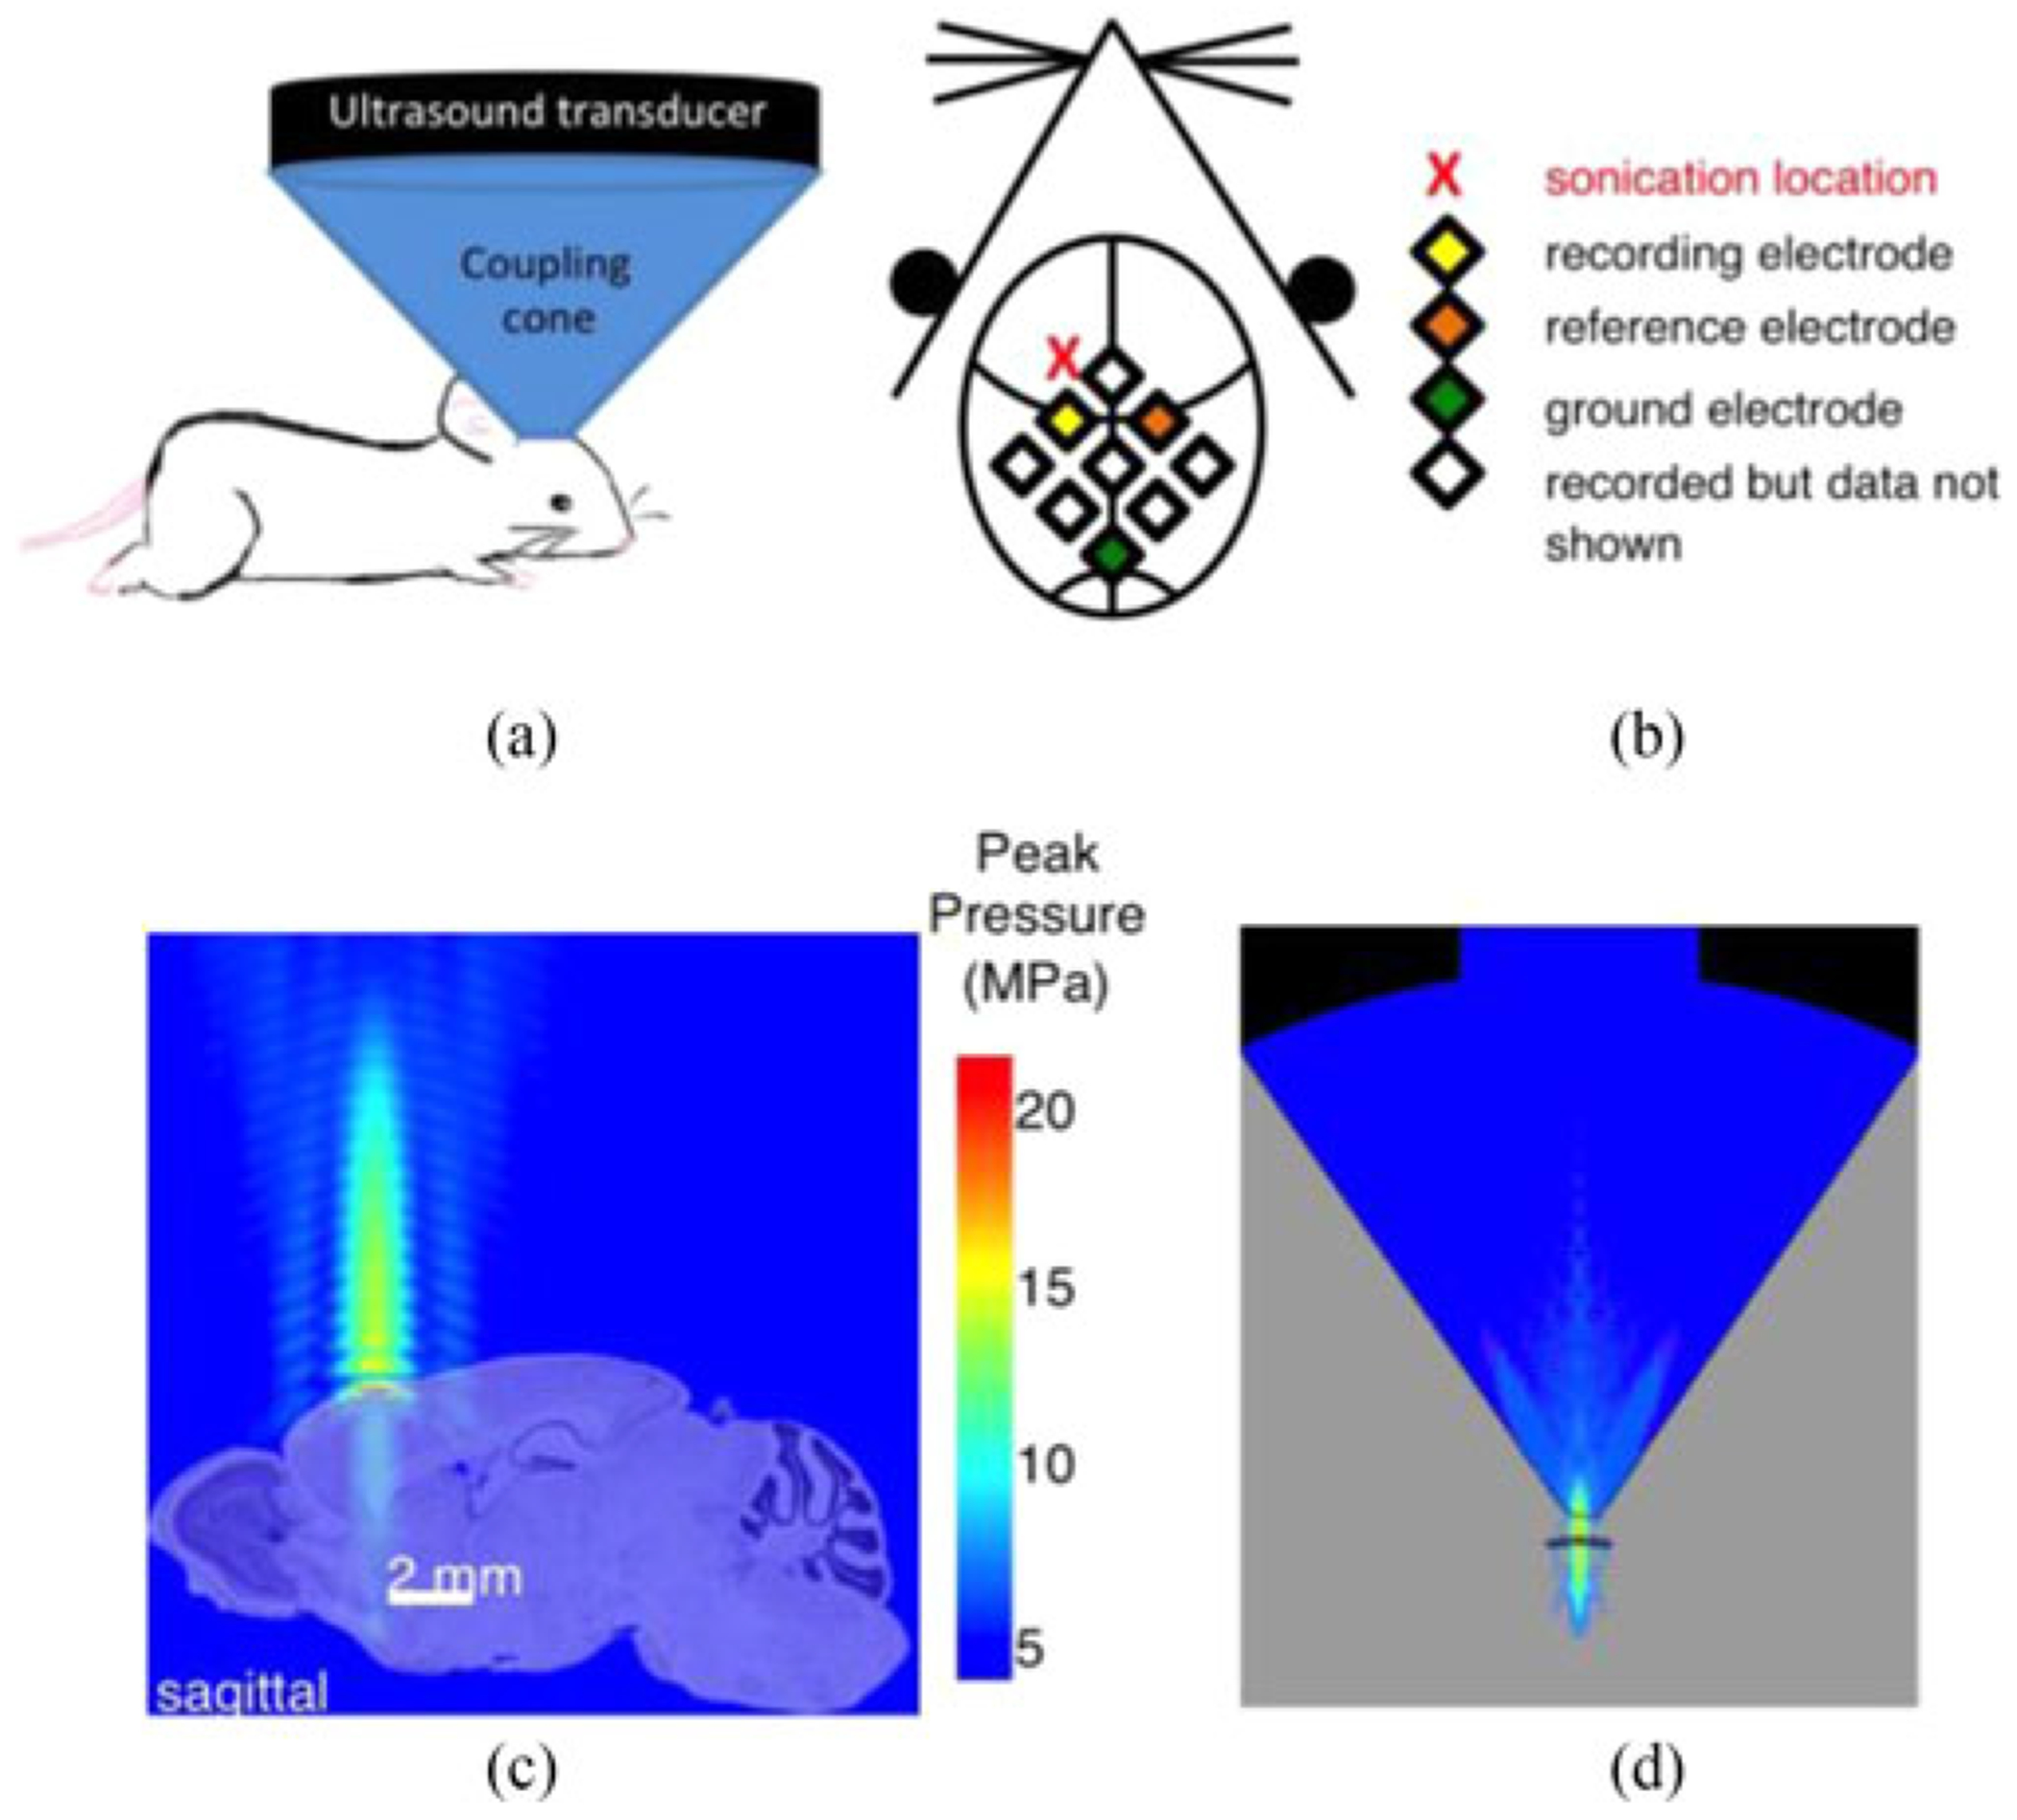
(a) An experimental configuration incorporating an ultrasound transducer for administering a non-contact brain perturbation. (b) A schematic of the sonication and recording locations. (c) A computer simulation showing the pressure profile of the ultrasound beam. The simulated pressure profile is overlaid on a sagittal section of a mouse brain to illustrate the perturbation morphology. Plotted pressures represent the maximum over a cycle. (Mouse brain image credit: © 2010 Allen Institute for Brain Science. Allen Brain Atlas, mouse.brain-map.org). (d) Cross-sectional image of full ultrasound beam profile within plexiglass transducer coupling cone.
The spatial profile of the focused ultrasound beam has been experimentally characterized for the H102 transducer in a homogenous aqueous medium [16], however, to estimate the spatial extent of the ultrasound perturbation in the animal, we utilized computational modeling via PZFlex (PZFlex Inc., Cupertino, CA) to obtain a pressure profile of the ultrasound beam. The simulations were able to treat nonlinear propagation effects arising from the high pressures used in the experiments, as well as reflection off of the skull. Fig. 2(c) depicts the ultrasound beam propagation from the transducer to the mouse’s head. The pressure is highest at the focus, concentrated tightly in the lateral dimension surrounding the axis of propagation, and the RMS pressure, prms, is ~1.6 MPa. Roughly 1 cm above the focus, as indicated by the color scale, the axial pressure level is at least a factor of 10 (−20 dB) lower. An expanded view of the pressure field above the head is provided in Fig. 2(d). The blue region represents the water-filled internal area of the acrylic transducer cone. To compute the energy delivered within the brain (just inside the skull), we use the plane-wave relation between ultrasound pressure and intensity: , where prms is the root-mean-squared pressure, ρ0 is the tissue density, and c0 is the speed of sound in the brain. In our typical settings, prms was ~1.6 MPa, and the intensity approximately 85 W/cm2. With an “on”-time of 0.01 s, the energy incident upon the brain is ~0.03 J per pulse. For context, these settings are roughly threefold higher than the upper bound of intensities that have been explored for ultrasound neuromodulation [17].
D. Electrophysiological Recording
SSEPs were elicited by stimulating the median nerve of the animal’s forelimb via a pair of 27-gauge stainless-steel hypodermic needles, secured with a wrist cuff made with silicone tubing [see Fig. 3(a)]. An electric stimulator (model SD9, Grass Technologies, Warwick, RI) delivered an electrical biphasic stimulus of 0.2 ms in duration, with frequency ranging from 0.5 to 8.4 Hz. Stimulus current was set to the minimum amplitude required to elicit visible limb movement in the forepaw. This value was typically ~1 mA, consistent with previous studies in rodents (cf. [18]).
Fig. 3.
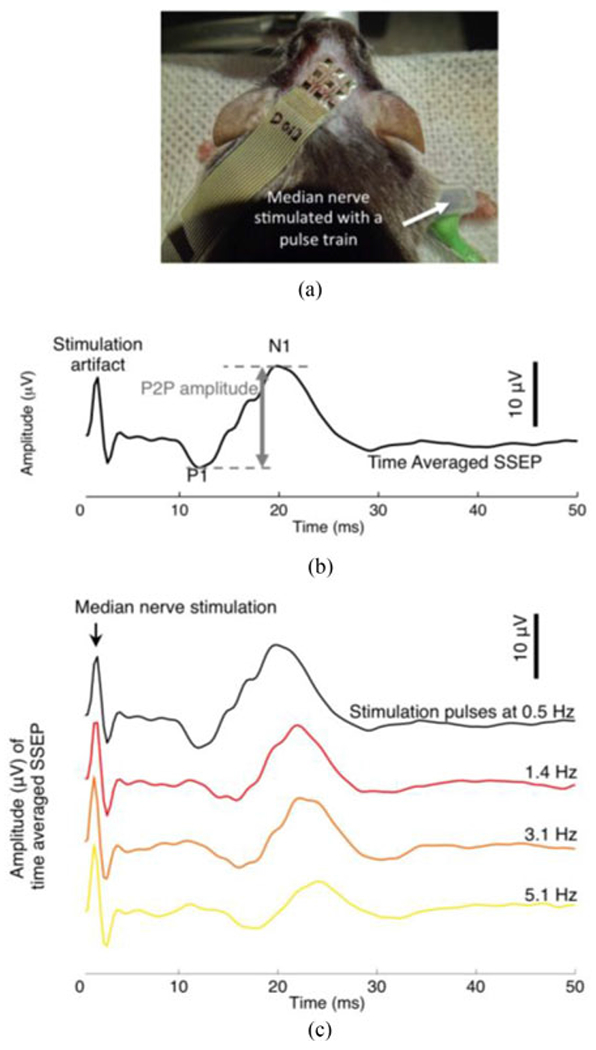
(a) A flexible electrode array positioned on the scalp of an anesthetized mouse during SSEP recording. (b) A time-averaged SSEP in response to electrical stimulation of the median nerve. The stimulation consisted of a pulse train of 0.2 ms biphasic pulses repeated at 0.5 Hz. Median nerve stimulation elicited prominent SSEP peaks, in this particular case, at ~13 ms (positive polarity, P1) and ~20 ms (negative polarity, N1). The SSEP shown is the average of 200 individual evoked trials. (c) Time-averaged SSEPs in response to median nerve electrical stimulation pulses delivered at a pulse frequency of 0.5 Hz, 1.4 Hz, 3.1 Hz and 5.1 Hz. Each averaged SSEP trace is the average of 200 individual evoked trials.
SSEPs were recorded in a “single-ended” configuration (RZ5D processor, PZ2 preamplifier, ZC16 headstage. TDT, Alachua, Florida) with a shared common ground. One of the 9 flexible electrodes functioned as the shared common ground electrode for all the other recording electrodes. SSEPs recorded from the electrode situated over the somatosensory cortex, S1, were referenced to those recorded from the contralateral electrode [see Fig. 3(b)]. Relative to the ultrasound focal position, the region of S1 maximally activated by median nerve stimulation was roughly 2 mm posterior. SSEPs were sampled at 3 kHz and bandpass filtered between 30–500 Hz based on conventional settings for measuring cortical evoked potentials [19]. 25 trials of SSEPs were averaged in real time to produce one averaged SSEP trace to achieve an acceptable signal to noise ratio, based on pilot experiments. All subsequent analysis was performed using custom MATLAB (The MathWorks Inc., Natick, MA) programs. Both the P1 and N1 were identified, and the peak-to-peak voltage amplitude between the two peaks was calculated [see Fig. 3(b)]. In a separate set of experiments, described previously [15], epidural SSEPs were obtained using platinum-iridium wires inserted into burr holes drilled through the skull, and rested against the surface of the dura. Epidural electrode impedance magnitude, measured at 1 kHz in situ, was typically between 7 and 17 kΩ.
E. Classifier for Brain Perturbation Detection
With an eye toward future use of these sensors outside of a basic research context, we sought to assess the diagnostic potential of this measurement configuration in the absence of a skilled researcher visually assessing the signals. Given that the sources of noise due to environmental and physiological variability are considerable, we implemented a generic algorithm for classification. We pooled all the relative peak-to-peak amplitude values, evoked at 0.5 Hz stimulation frequency, for each animal from all available post-perturbation time points. We then randomly stratified those relative peak-to-peak amplitudes into a training set and a test set, each set encompassing half of the amplitudes values. With the training set, we created a binary classifier using logistic regression. Briefly, we utilized the fitglm function from the Matlab Statistics and Machine Learning Toolbox to fit the training set to a generalized linear model with a logit link function. We quantified the binary classifier’s accuracy on the test set data using a receiver operating characteristic (ROC) curve. An ROC curve is typically used to illustrate the accuracy of a medical diagnostic test; it shows the tradeoff between the true positive rate (sensitivity) and the false positive rate (1-specificity) of a given diagnostic test. The true condition, i.e., the ground truth, was based on our assumption that no neural perturbation was elicited in animals with sham treatment (true negative, N = 8) and that modulation consistently occurred during focused ultrasound (true positive, N = 14).
III. Results
A. Recording SSEPs With Flexible Epidermal Electrodes
Electrical stimulation of the median nerve in anesthetized mice evoked robust and characteristic peaks [see Fig. 3(b)] in the somatosensory cortex. The first prominent peak (P1, positive polarity) typically occurred around 13 ms to 20 ms after the stimulation; the second prominent peak (N1, negative polarity) typically occurred around 18 ms to 29 ms. We define the SSEP amplitude as the peak-to-peak amplitude difference between P1 and N1. Note that following the conventions of the clinical neurophysiology field, evoked potentials are plotted with inverted values on the ordinate axis.
To demonstrate that flexible epidermal electrodes can capture basic dynamics of SSEPs, we performed median nerve stimulation at four different frequencies (0.5, 1.4, 3.1 and 5.1 Hz). The dependence of SSEP amplitudes and latencies on stimulation frequency is well-established in humans [19]–[21] and rodents [22]. In general, as stimulus frequency increases, peak latencies increase and peak amplitudes decrease. We characterized the frequency-dependence of SSEP peak amplitudes and latencies (see Fig. 4). Consistent with the established trend, peak amplitudes decreased and peak latencies increased monotonically as a function of stimulation frequency.
Fig. 4.
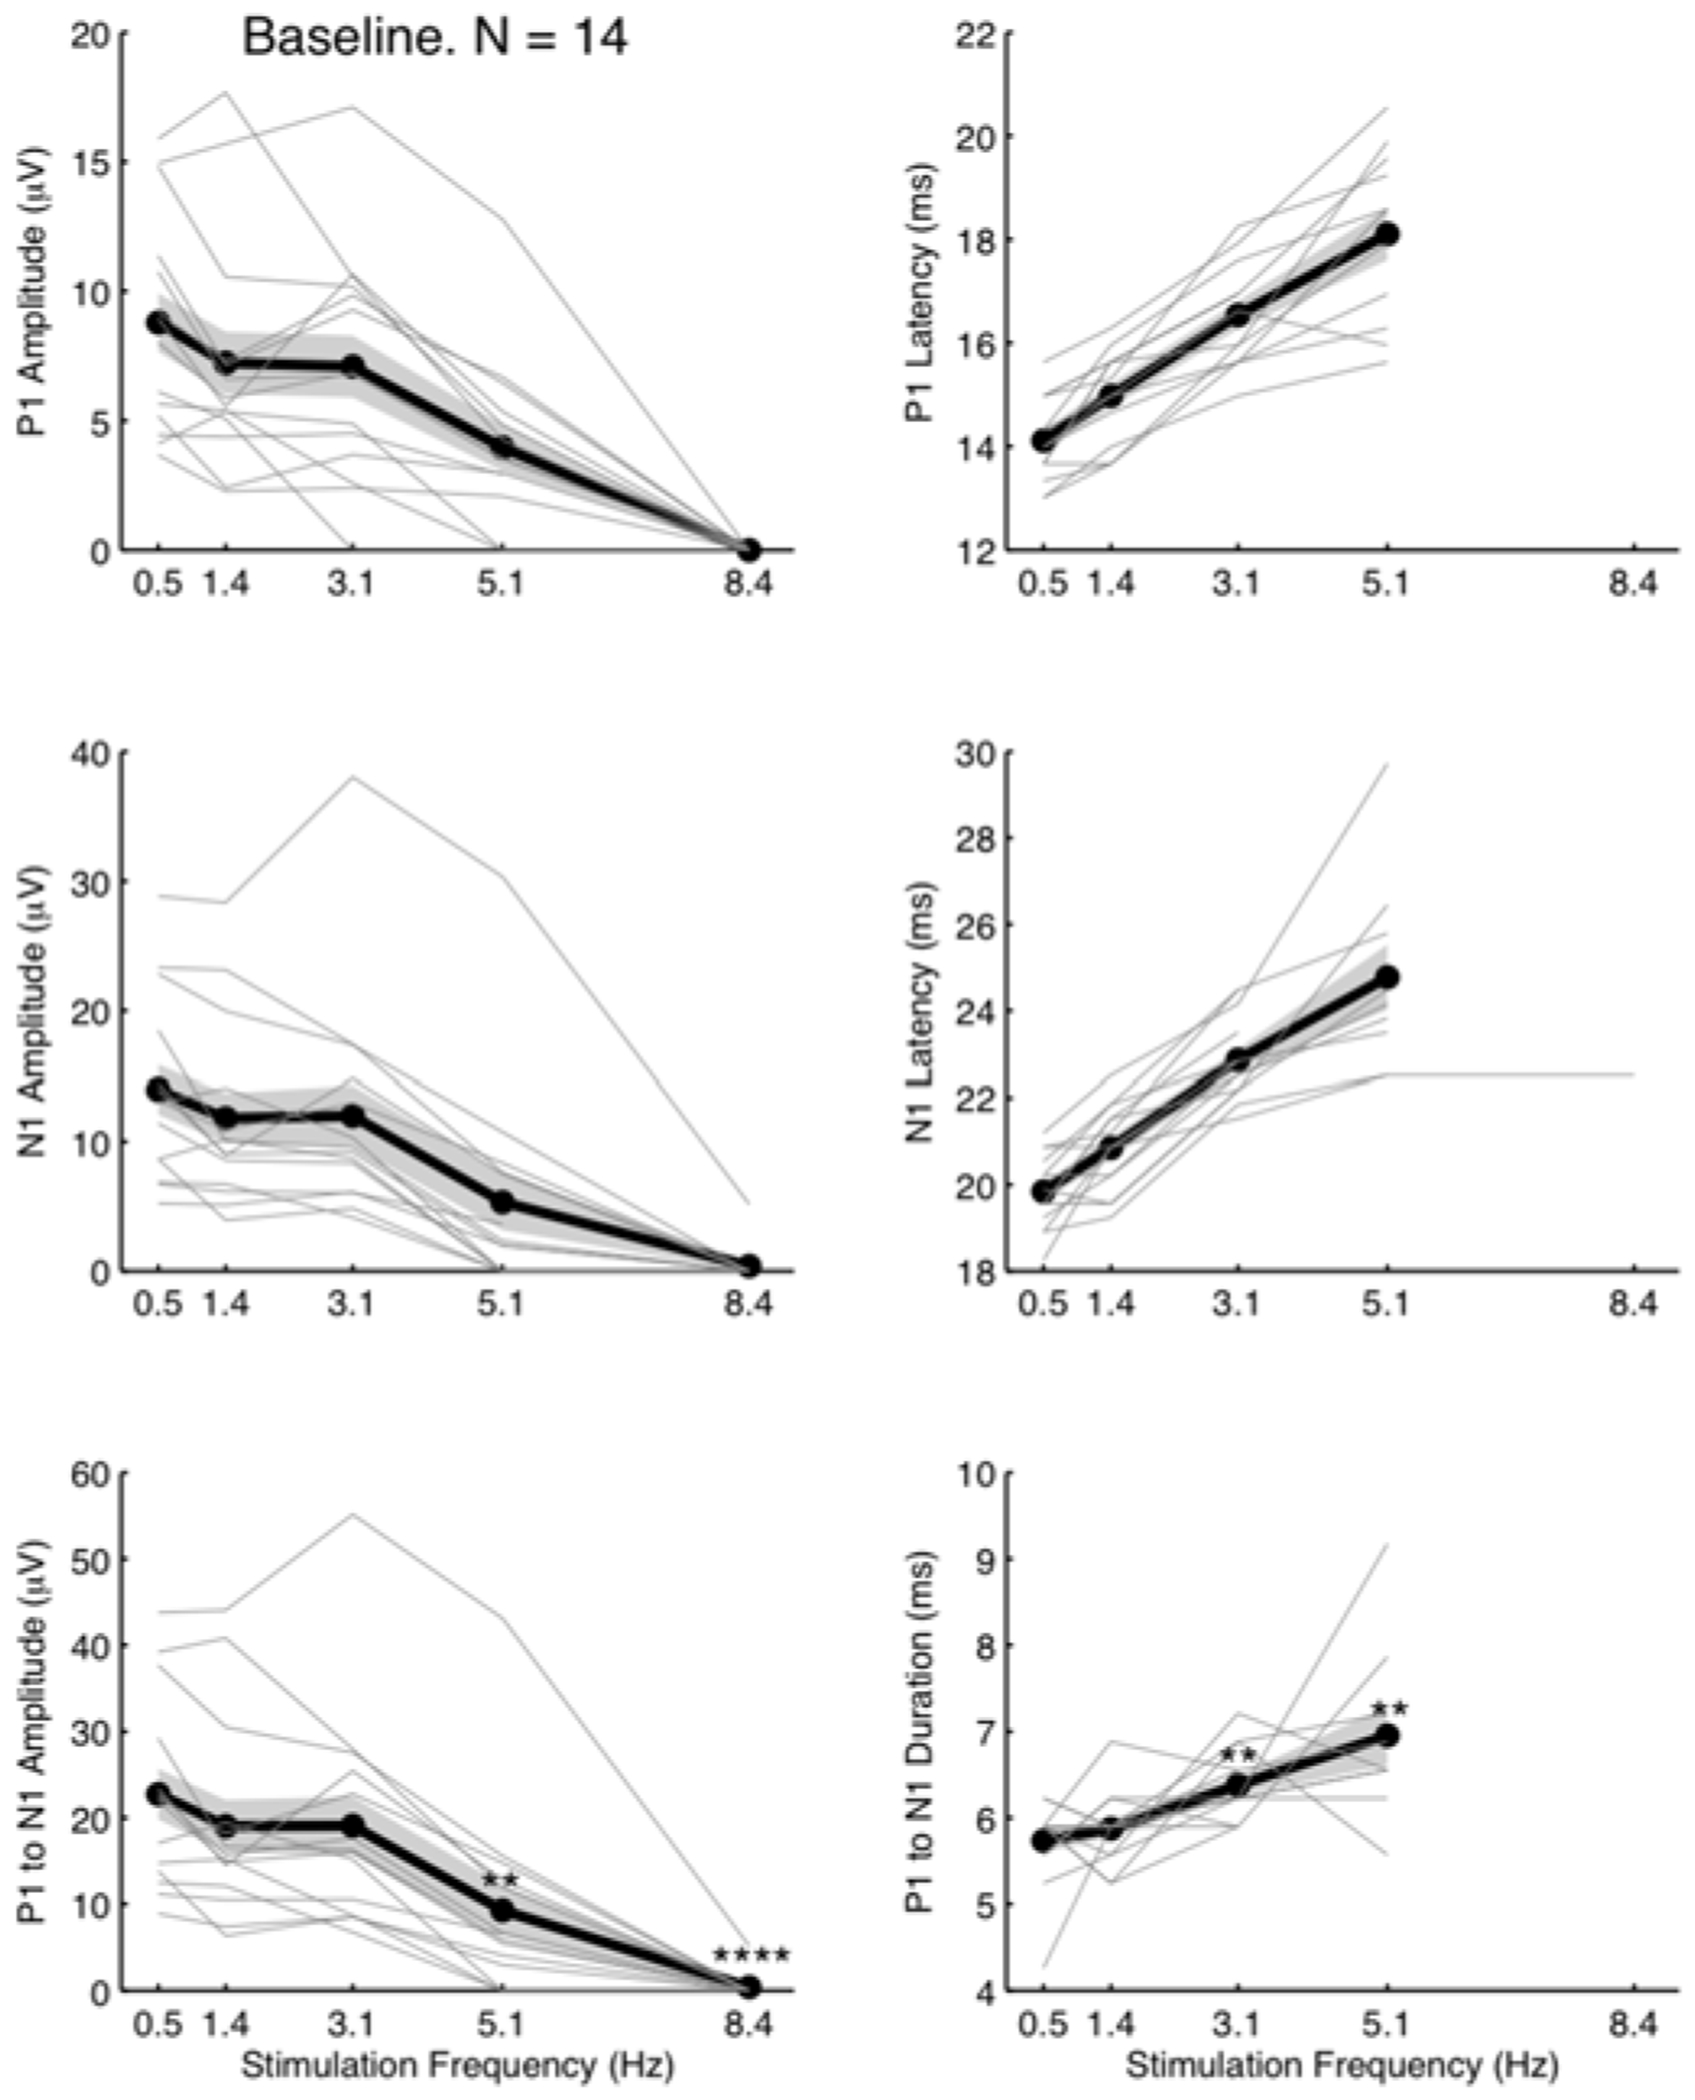
The impact of stimulation frequency on baseline SSEP amplitude metrics. The peak metrics are extracted from time-averaged SSEPs (25 trials). Each animal (N = 14) is represented by one gray line. The mean (thick black line) and the standard error (grey shaded region) showed diminishing peak amplitudes and lengthening latencies with increasing stimulation frequencies. At stimulation frequency of 8.4 Hz, the SSEP was no longer discernable from the noise floor, preventing a measurement of latency or duration. We performed a two-tailed Student’s t-test to determine whether P1 to N1 mean amplitude (bottom left panel) and duration (bottom right panel) at each stimulation frequency were significantly different from those at 0.5 Hz. ** indicates P < 0.01 and **** P < 0.0001.
At low stimulation frequencies (i.e., below 3.1 Hz), P1 and N1 peak amplitudes were as high as tens of μV·s. At higher frequencies, P1 and N1 peaks were frequently below the noise floor, in which case the amplitudes were set to zero for analysis purposes.
B. Benchmarking Flexible Epidermal Sensor Performance Against Epidural Recordings
In general, SSEP recordings that are obtained with invasive metal electrodes yield higher signal amplitudes than can be obtained by flexible epidermal electrodes, because skin and skull both degrade and attenuate the signals detected at the scalp surface. To quantify the degree of signal attenuation, we benchmarked the signal and noise levels of flexible electrodes against those obtained via invasive epidural electrodes. In addition to the cohort of animals that were measured with flexible epidermal electrodes, we performed SSEP recordings with invasive electrodes on a separate cohort of 8 mice.
Fig. 5(a) shows one representative SSEP recorded with flexible epidermal electrodes and one recorded with invasive electrodes. The two representative SSEPs were chosen because their peak amplitudes were near the median peak amplitudes in their respective cohort. The signal level of SSEPs recorded with invasive electrodes was approximately one order of magnitude higher than those recorded with flexible epidermal electrodes.
Fig. 5.
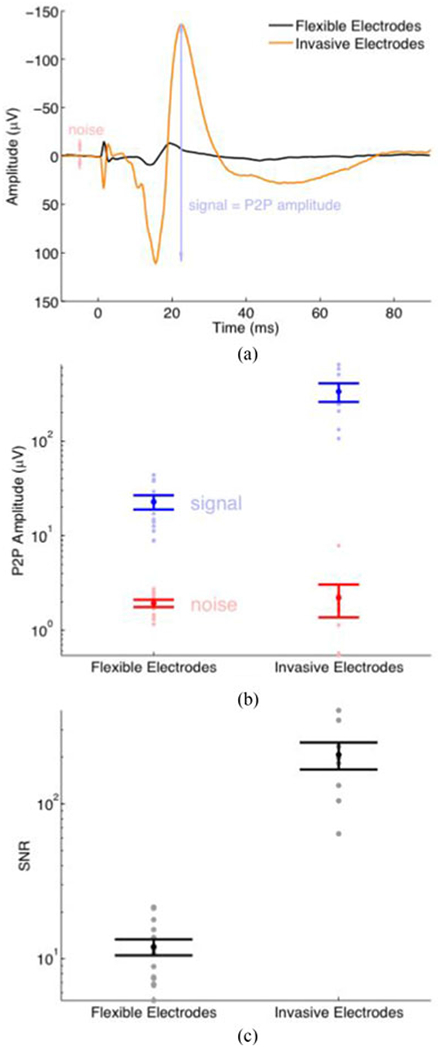
Signal-to-noise ratio (SNR) comparison of flexible epidermal electrodes and conventional invasive electrodes. (a) A representative average SSEP recorded with flexible epidermal electrodes (black, an average of 25 evoked trials) and conventional invasive electrodes (orange, an average of 20 evoked trials). We define the noise as the maximum peak-to-peak amplitude within the pre-stimulation period. (b) Signal and noise levels of SSEPs, one for each animal. (Flexible: N = 14; Invasive: N = 8.) The error bars represent the standard error of the mean. (c) The SNR derived from the SSEPs. SNR = (peak-to-peak amplitude of the SSEP) / (peak-to-peak amplitude of pre-stimulation baseline).
The peak-to-peak amplitude of the flexible electrodes was 22.7 ± 3.0 μV (mean ± standard error), and the signal to noise ratio (SNR) was 11.9 ± 1.4. In comparison, the signal amplitudes of the invasive electrodes were 335.2 ± 75.0 μV, and SNR was ~ 207 ± 41 [see Fig. 5(b) and (c)].
The noise levels recorded with the invasive electrodes were within the same order of magnitude of those with flexible epidermal electrodes, despite the invasive electrodes’ signal levels being approximately one order of magnitude higher; as a result, invasive electrodes’ overall SNR was one order of magnitude higher.
C. Localized Perturbation Dynamically Modifies SSEPs
In aggregate (N = 14), following perturbation there was an immediate reduction in the amplitudes of P1 and N1 as well as peak-to-peak amplitudes, followed by a gradual, though incomplete, recovery within 60 minutes [see Fig. 6(a) and (b)]. The recovery was not always monotonic. Fig. 6(a) shows the temporal evolution of the SSEP for a representative animal, recorded with flexible electrodes, before and after perturbation.
Fig. 6.
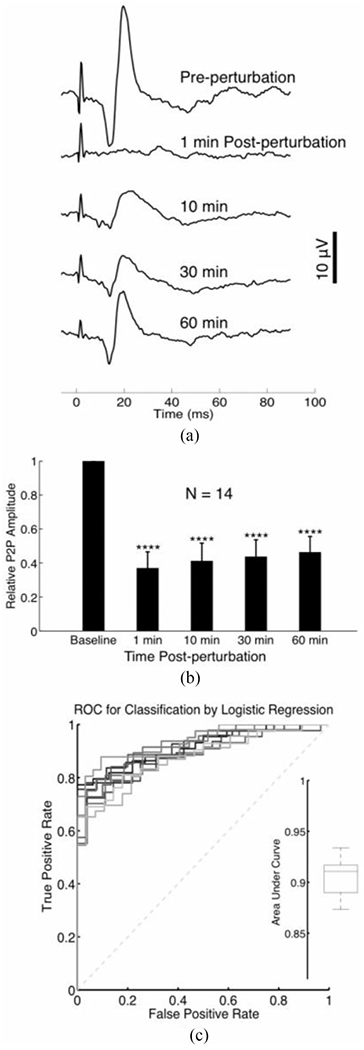
(a) A representative time course of SSEPs recorded with a flexible electrode array before and after 3 J (100 pulses) of ultrasound-induced perturbation. Each trace is the average of 25 evoked trials. Electrical stimulation pulses were delivered at 0.5 Hz. (b) Bar chart depicting the normalized trends in SSEP amplitude, recorded with a flexible epidermal array, following ultrasound perturbation. We performed a Student’s t-test to determine whether relative P2P amplitudes post perturbation were significantly different from baseline (pre-perturbation). The asterisks indicate P-value ranges resulting from a two-tailed Student’s t-test, as follows: * indicates P < 0.05, ** P < 0.01, *** P < 0.001, and **** P < 0.0001. (c) ROC curves of a binary classifier based on logistic regression. The performance of the binary classifier was evaluated 10 times, where one ROC curve was plotted during each evaluation. The box plot in the inset summarized the area under each ROC curve. The data were pooled from all available post-perturbation time points presented in Fig. 8.
The performance of our binary classifier is depicted on an ROC curve in Fig. 6(b). The area under the curve was approximately 0.9 from 10 random trials (area under curve median 0.91, minimum 0.87, maximum 0.93, 1st quartile 0.89, 3rd quartile 0.92), attaining near-perfect performance at detecting perturbation.
The largest SSEP recorded by the electrode contact positioned over somatosensory cortex contralateral to median nerve stimulation (channel C2) as compared to ipsilateral somatosensory cortex (channel C4) or other cortical regions [channel C1, C3, C5-8; Fig. 7(a) and (b)]. Ultrasound perturbation decreases the amplitude of SSEPs recorded by channel C2 [red trace, Fig. 7(b)], in contrast to sham stimulation which produces no amplitude modulation [blue trace, Fig. 7(a)].
Fig. 7.
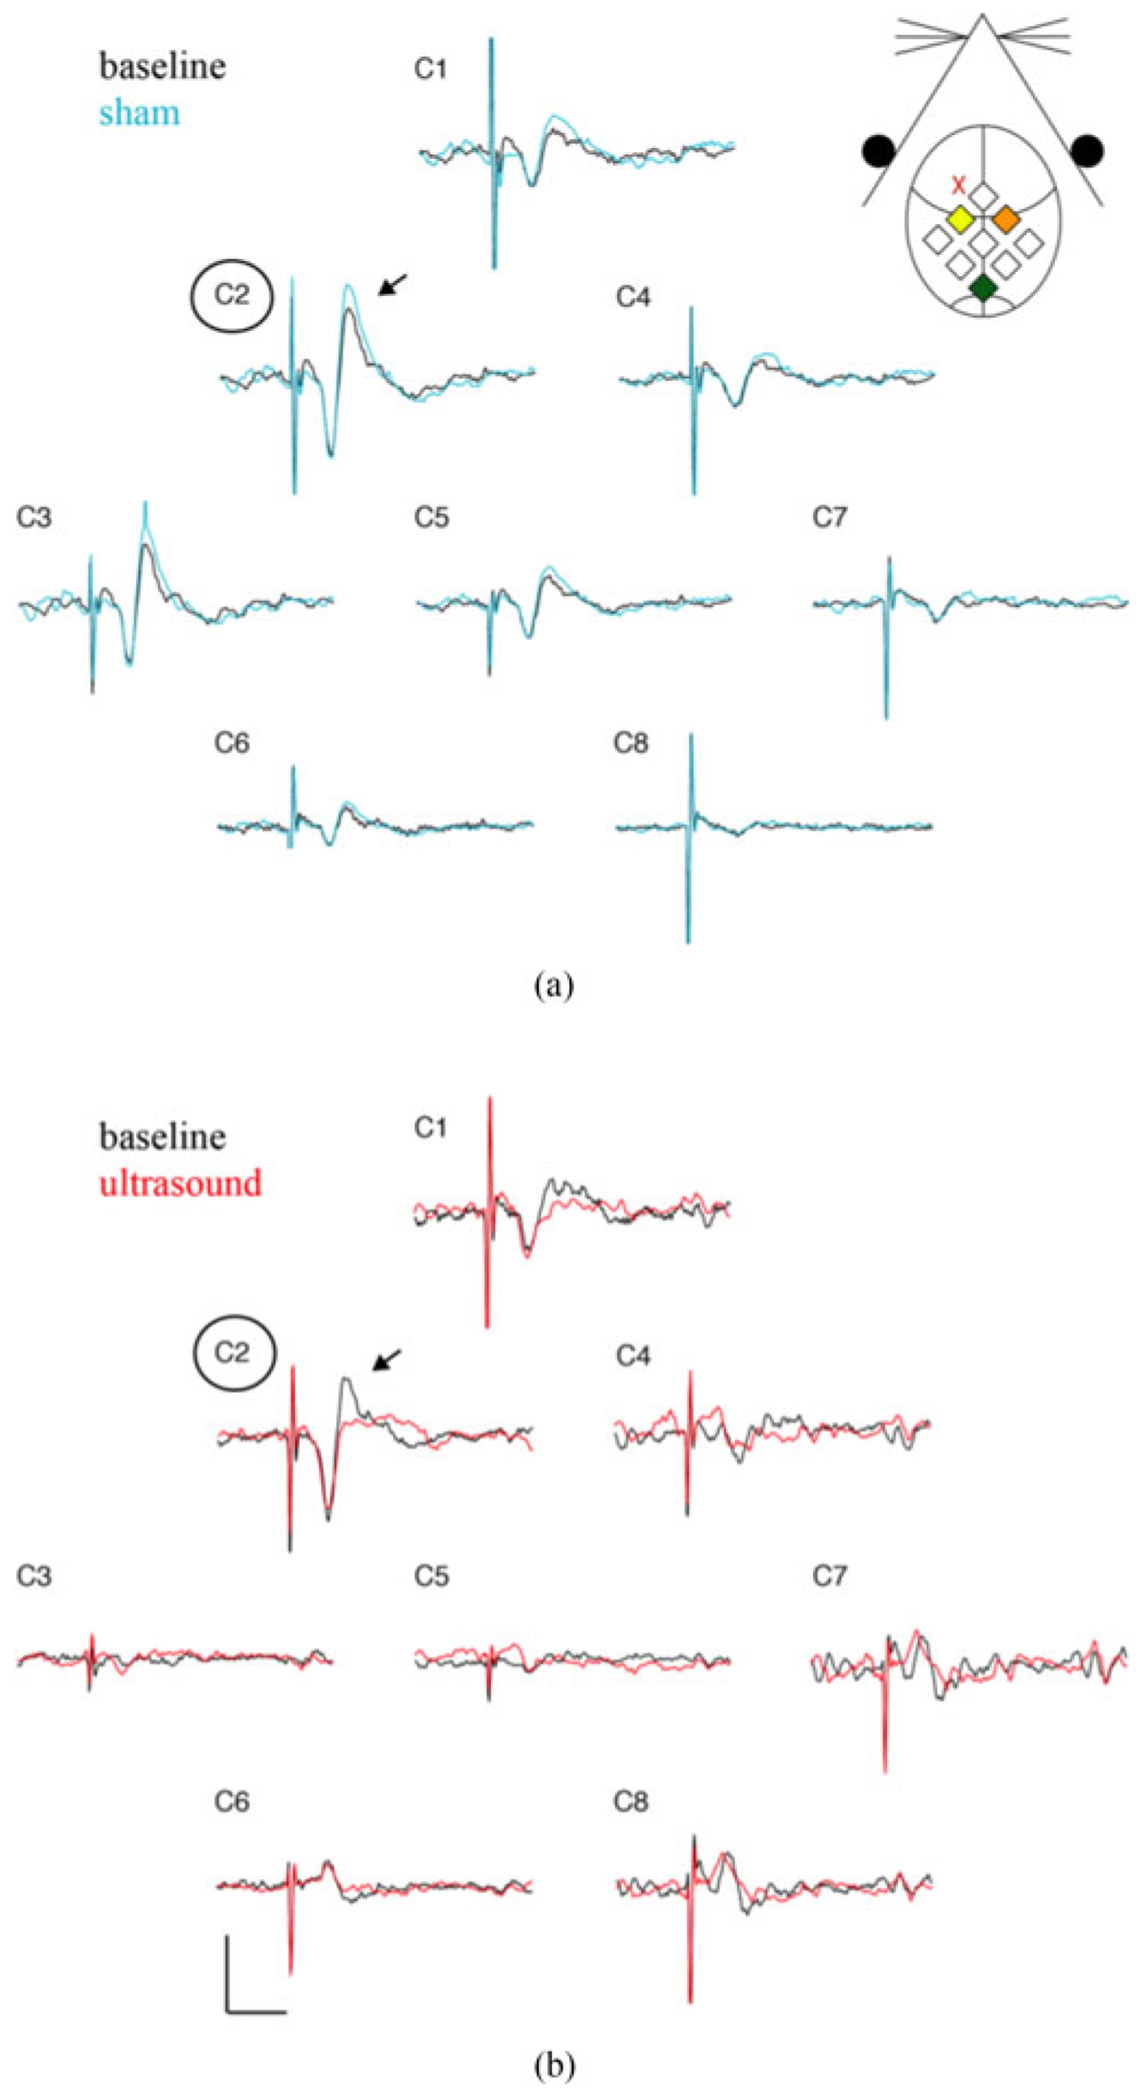
SSEP recordings from all recording electrode contacts. (a) Baseline (black) and sham (blue) SSEP recordings from each of the recording contacts (C1-C8). A schematic of channel position with respect the mouse anatomy is shown in the inset. Channel C2 (yellow diamond) is positioned over the somatosensory cortex contralateral to the stimulated median nerve, while channel C4 (orange diamond) is positioned over the ipsilateral somatosensory cortex. Channel C2 records the largest SSEP amplitude (arrow). Sham stimulation does not alter the amplitude for any channel. (b) Baseline (black) and ultrasound perturbed (red) SSEP recordings for each channel. Ultrasound application, located at the red “X” in the inset, reduces the amplitude of the recorded SSEP in contralateral somatosensory cortex (C2). Scale bar is 10 μV and 20 ms.
D. The Impact of Perturbation Intensity on Electrophysiological Signals
We additionally used our non-contact in vivo model to explore the perturbation intensity dependence of signals that were detected by flexible sensors. Out of the 14 animals exposed to focused ultrasound, four animals were exposed to 40 pulses (0.03 J/pulse at our sonication settings), five animals to 100 pulses and five to 300 pulses. Fig. 8 shows the time course of SSEP amplitude change, at each perturbation severity level, within the first 60 minutes after brain perturbation.
Fig. 8.
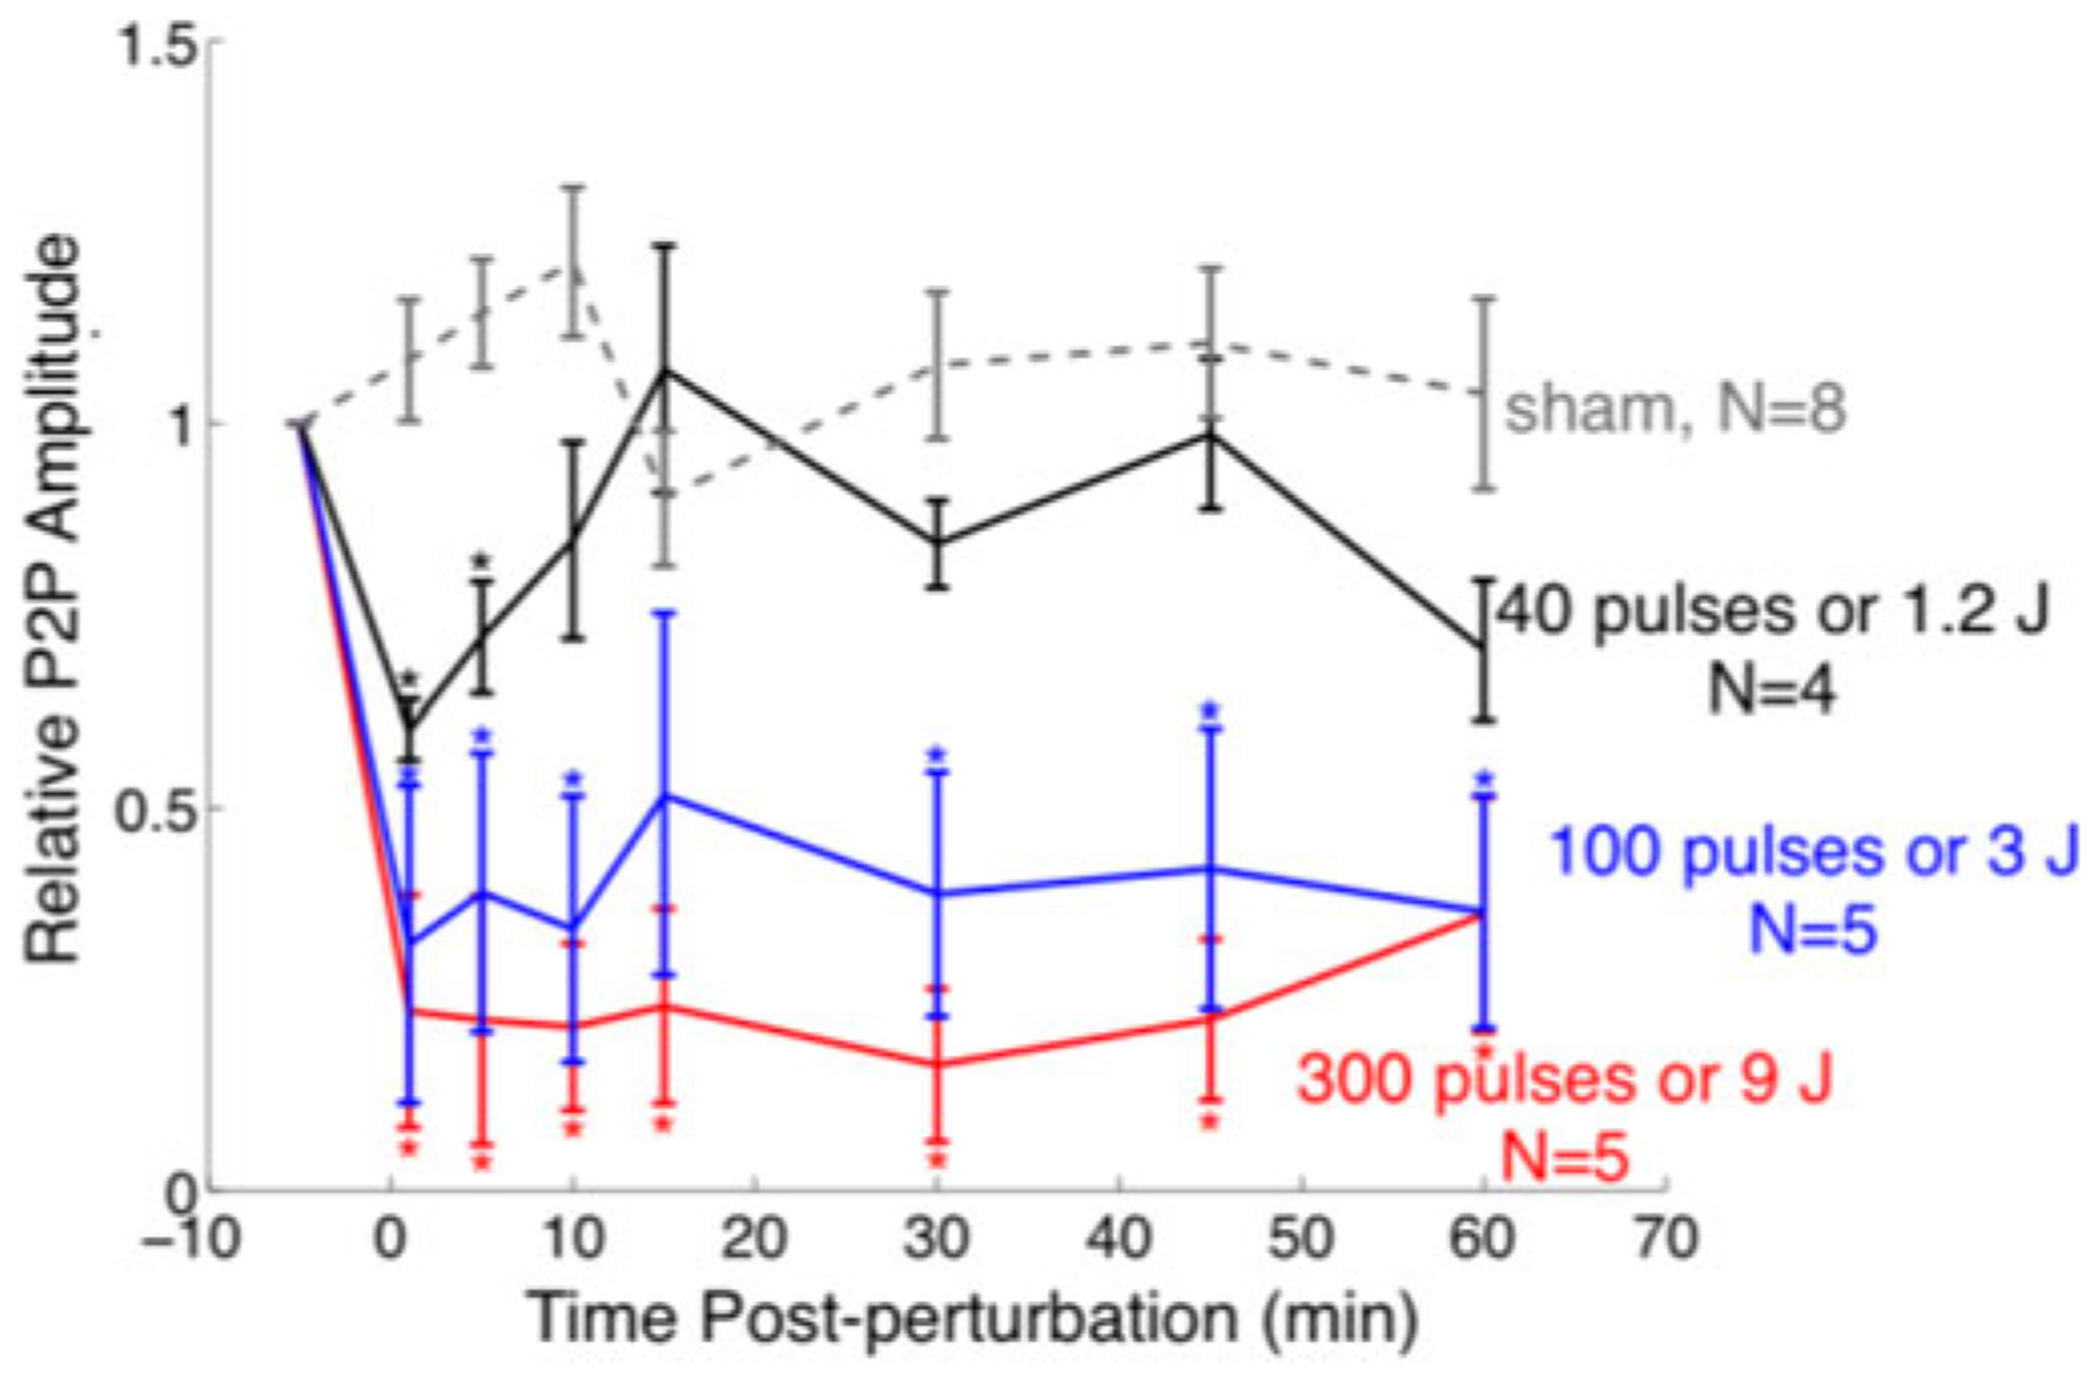
Dose-response of ultrasonic perturbation. A time course of SSEP Peak-to-peak amplitude change before and after an acute brain perturbation produced by 0 (sham), 1.2, 3 and 9 J or 0 (sham), 40, 100 and 300 pulses of ultrasound exposure. Error bars represent standard error. * denotes the relative P2P amplitudes that were significantly different (two-tailed Student’s t-test, P < 0.05) from those of sham at each time point. Significance: Flexible epidermal electrode recordings were sensitive to different levels of severity of brain perturbation produced by graded ultrasound exposure.
Animals exposed to 1.2 J of focused ultrasound experienced a ~40% drop in SSEP amplitude, but recovered to baseline levels within the first 15 minutes. After 15 minutes, the mean relative SSEP amplitude fluctuated between 70% to 99% of the baseline level. Animals exposed to 3 J and 9 J of ultrasound sustained, respectively, a 68% and 77% drop in amplitude immediately after perturbation, but failed to recover to pre-perturbation levels. After 3 J deposited by focused ultrasound, the mean amplitude remained low, within 32% and 52% of the pre-perturbation level; after 9 J of ultrasound perturbation, the mean SSEP amplitude ranged within 16% and 36% of the pre-perturbation level. For context, the RMS ultrasound pressure per pulse used here is approximately one half the value that has been reported to elicit histological evidence of mild brain trauma [23].
E. Focal Neural Perturbation Modifies SSEPs Across All Stimulation Frequencies
The frequency-dependence of the SSEP was maintained during the post-perturbation changes in amplitude. Fig. 9 depicts plot peak metrics (P1 amplitude, N1 amplitude, P1 to N1 amplitude) for one representative animal with brain perturbation and one sham animal. Although there have been reports of persistent, evoked brain stimulation in such sham conditions [24], no sham animal exhibited a significant SSEP amplitude reduction at any stimulus frequency. Fig. 10 summarizes these amplitude changes (N = 14 ultrasound treated, N = 8 sham) as a function of stimulation frequency. There was no significant post perturbation change in the latency of any major peak.
Fig. 9.
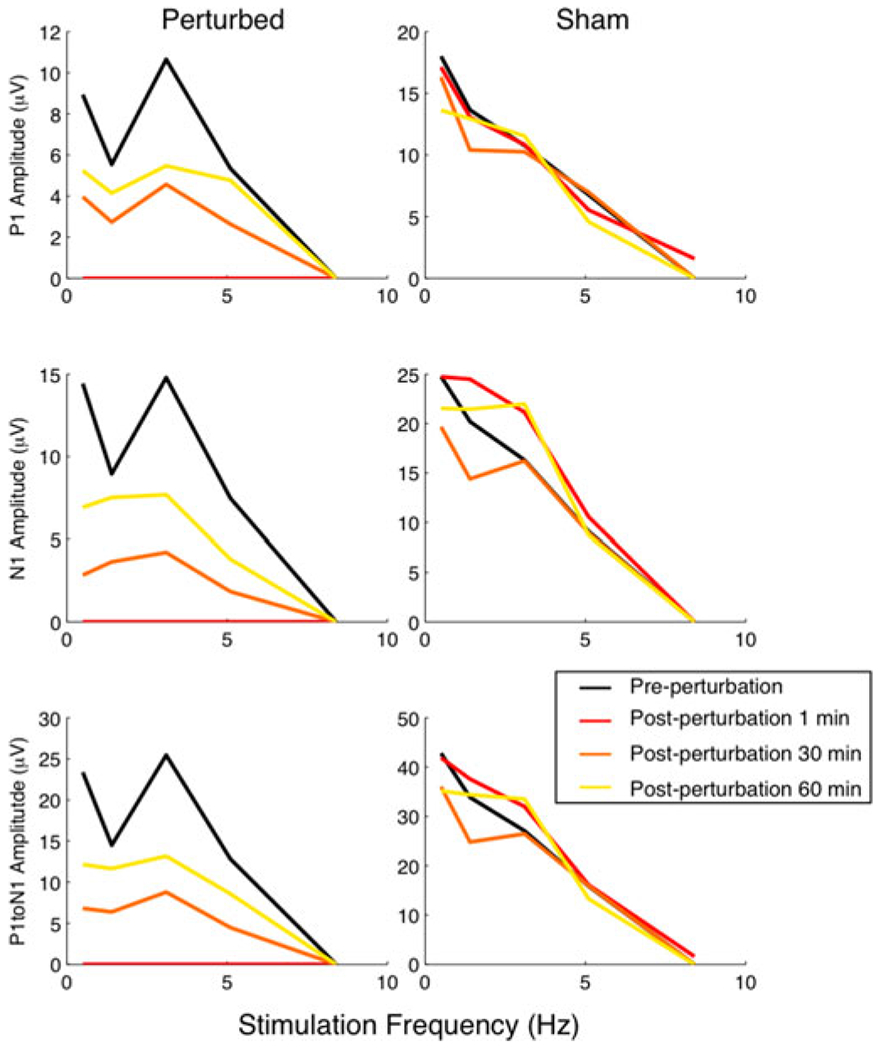
Representative examples demonstrating the changes in SSEP peak amplitude and latencies due to perturbation. This particular treated animal received 3 J (100 pulses) of ultrasound. The sham animal received no ultrasound.
Fig. 10.
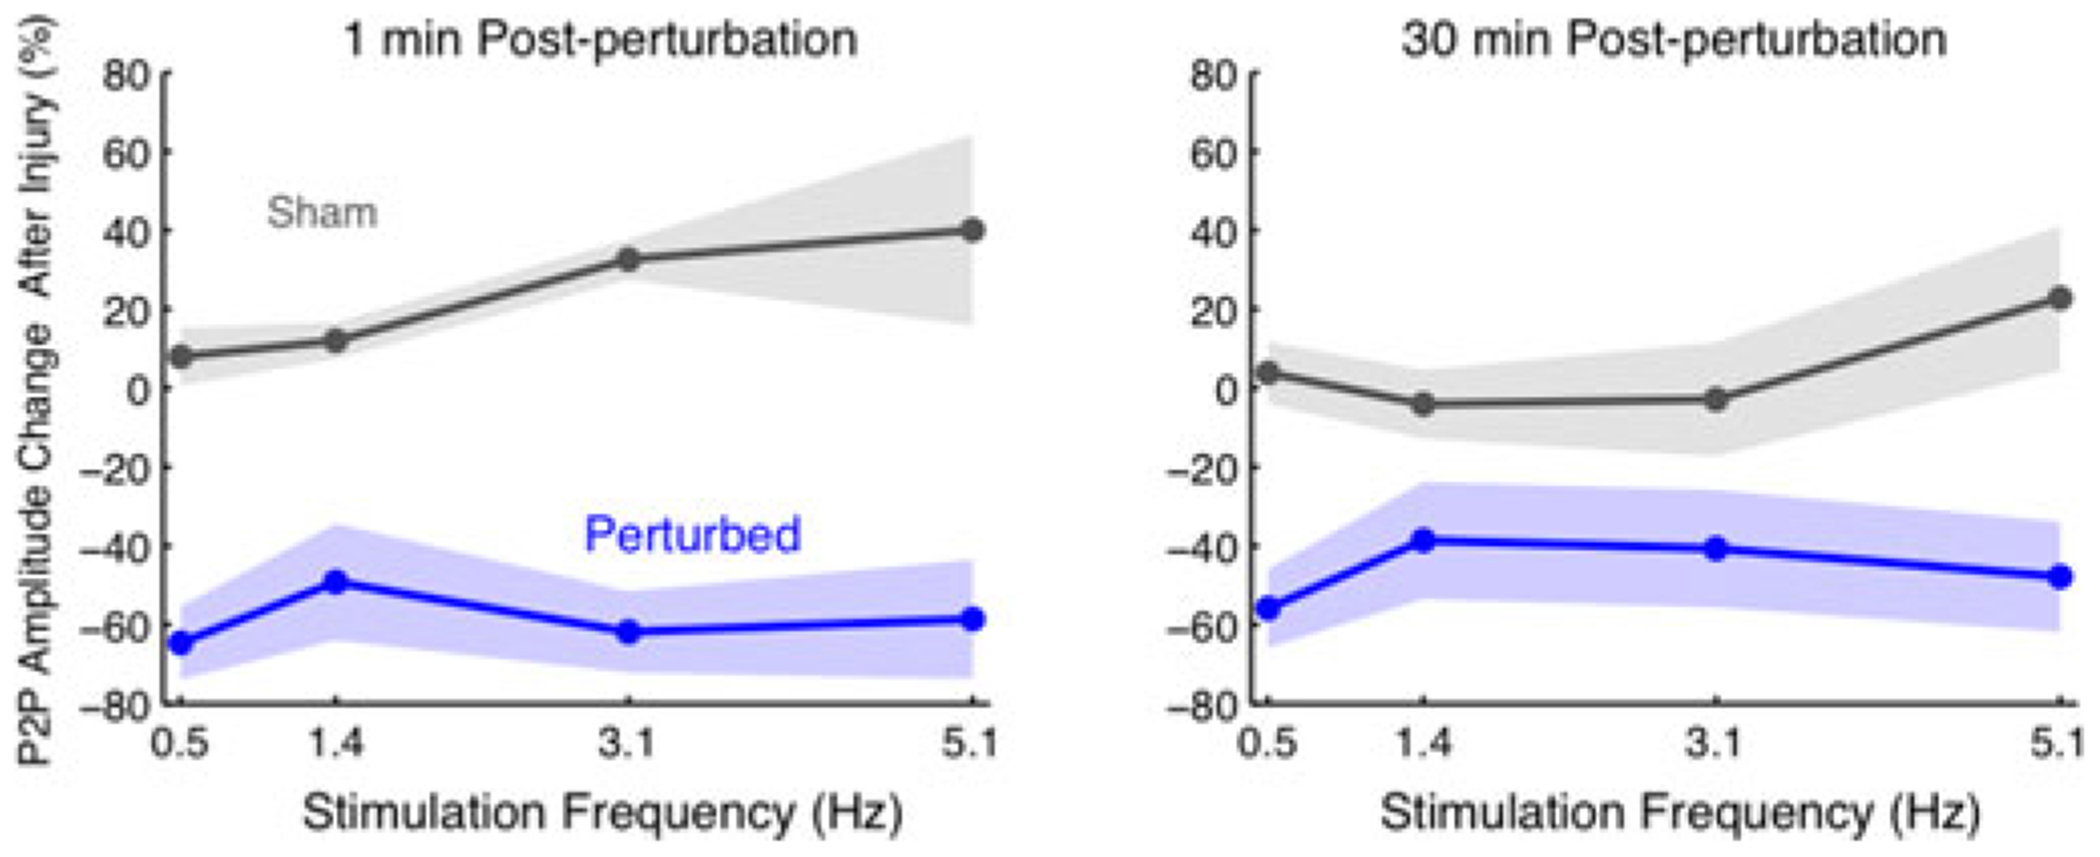
Post-perturbation changes in peak-to-peak amplitudes and P1 latencies. The shaded region represents the standard error of the mean. (Perturbed N = 14; Sham N = 8.) Amplitudes exhibited on average a 50% to 60% reduction across all frequencies, immediately following an acute perturbation and a gradual recovery. Latencies however did not appear to change significantly (data not shown).
IV. Discussion
A. Flexible Epidermal Electrodes Detect Physiologically-Relevant Perturbations of Neuronal Circuitry
Prior work with flexible epidermal electrode technology has demonstrated the feasibility of detecting major features of the human EEG [5], [6]. However, the capability of this class of devices to detect subtler, yet functionally significant, neurophysiological modulation has not been previously established. In our investigations, the use of a non-contact animal model of neural perturbation permitted us to directly assess this capability. SSEPs are a feature of brain activity commonly measured in humans for both clinical and research purposes, and the basic waveform elements and frequency-response characteristics have been well characterized [20]–[22]. In this work, we found flexible epidermal electrode sensor technology has sufficient resolving power to discriminate between frequency-induced alterations in SSEPs and can be used to resolve both the hallmark P1 and N1 components of the response. Following neural perturbation, flexible epidermal electrodes were sensitive to alterations in SSEP amplitude, successfully reproducing prior results that have been obtained via invasive electrodes [15]. Furthermore, measurements using these electrodes demonstrated that the amplitude of evoked neural activity was reduced proportionally to the magnitude of the ultrasonic perturbation. Together, these results demonstrate that flexible electrodes are capable of capturing the modulation of brain circuitry in vivo. In addition, they further support the translational opportunity for investigations spanning rodents to humans.
B. Translational Potential for Flexible Epidermal Electrodes
Non-invasive electrodes for clinical use are critical for diagnosing a wide range of neurological conditions. In the operating room, SSEPs are widely used for intraoperative neurophysiological monitoring of the health and integrity of the central and peripheral nervous systems. For example, during the placement of spinal cord stimulation leads, monitoring SSEPs can reduce the risk of positional ulnar neuropathy [26] and other intraoperative insults [26], [27]. Recently, SSEPs have been increasingly used monitor brain function and to inform prognosis for comatose patients [28]–[31] as well as patients who have suffered acute stroke [32], cardiac arrest [33], [34], and patients who have multiple sclerosis [35], [36]. More broadly, detecting subtle perturbations in EEG has widespread clinical implications, including but not limited to detection of seizures, traumatic brain injury [37], and a wide range of other neurological disorders. Current clinical administration of SSEPs requires the use of bulky metal electrodes that can be cumbersome to apply. Detection devices that have a low spatial profile and that can be rapidly and easily applied could facilitate easier clinical implementation and have potential for use outside the clinic. Results from our studies demonstrate the feasibility of using epidermal electrode technology to detect critical features of SSEPs for diagnostic purposes, with implications for neurological monitoring for research, clinical and translational purposes.
C. Use of Ultrasound for Neural Perturbation
Although the exact relationship between focused ultrasound intensity and neural function is the subject of ongoing research, it is well-established that low intensity focused ultrasound can transiently modulate neural activity [38] and at higher intensities can elicit brief permeations of the blood brain barrier [39] or, at very high intensities, can cause neural tissue injury [40], [41]. In contrast to lesion studies that involve invasive damage or removal of brain regions and do not accommodate real-time monitoring, the use of focused ultrasound enabled us to deliver calibrated, non-contact doses of mechanical energy to focal regions of the brain, and to concurrently perform electrophysiological recordings with adhesive and conformal detectors. Another advantage of ultrasound is the potential for beam shaping. Although in this study we employed a single focused ultrasound transducer, with a phased array, arbitrary spatial patterns can be generated, enabling the perturbation of multiple brain regions simultaneously, or in various temporal sequences. These results demonstrate that epidermal electrodes can serve as a powerful tool for noninvasive monitoring of ultrasound-induced modulation of brain activity.
D. SNR Considerations
Single-trial recordings of SSEPs with flexible epidermal electrodes typically had an SNR of less than 1. Because averaging over many trials was required, obtaining a sufficient SNR at low stimulus frequencies required acquisition times on the order of minutes. Such long averaging durations, in turn, limit the effective temporal resolution with which SSEP dynamics can be observed. In our implementation, a stimulation frequency of 3.1 Hz offered an excellent trade-off between SNR and temporal resolution, in agreement with recommendations by the American Clinical Neurophysiology Society for SSEP recordings in humans [41].
V. Conclusion
Bridging innovation in neural sensor technology to implementation in human subjects requires substantial experimental validation of safety and predicted efficacy. Through utilization of a non-contact neuromodulation technology, we conducted a comprehensive evaluation of the performance of flexible epidermal electrodes in an animal model. We characterized device sensitivity for neurological monitoring of sensory brain activity, along with capability to detect localized brain perturbations, benchmarked against invasive electrode recordings. We find flexible epidermal technology to have robust detection capabilities for evoked potentials produced by healthy and perturbed neural circuits, with signal-to-noise ratios relevant for neurological monitoring. These results provide a key step towards the demonstration of the translational potential for flexible epidermal electrode technology in the diagnosis and monitoring of neurological conditions.
Acknowledgment
The authors thank Dr. E. F. Civillico, J. T. McCabe and Dr. W. B. Wilent for helpful discussions regarding experimental design and data analysis, Dr. Y. Liu and Dr. Y. H. Kim, Dr. C. Scully, Dr. D. Soltysik, Dr. S. Vasudevan, and the members of our research group within Division of Biomedical Physics and Division of Applied Mechanics for technical assistance and for valuable comments on the manuscript. The mention of commercial products, their sources, or their use in connection with material reported herein is not to be construed as either an actual or implied endorsement of such products by the Department of Health and Human Services.
The work of C. G. Welle was supported by FDA Medical Countermeasures Initiative 274 and the work of J. A. N. Fisher was supported by New York Medical.
Contributor Information
Stanley Huang, Center for Devices and Radiological Health, U.S. Food and Drug Administration.
Jonathan A. N. Fisher, Department of Physiology, New York Medical College.
Meijun Ye, Center for Devices and Radiological Health, U.S. Food and Drug Administration.
Yun-Soung Kim, Department of Bioengineering, University of California, San Diego.
Rui Ma, Department of Bioengineering, University of California, San Diego.
Marjan Nabili, Center for Devices and Radiological Health, U.S. Food and Drug Administration.
Victor Krauthamer, Center for Devices and Radiological Health, U.S. Food and Drug Administration.
Matthew R. Myers, Center for Devices and Radiological Health, U.S. Food and Drug Administration
Todd P. Coleman, Department of Bioengineering, University of California, San Diego.
Cristin G. Welle, University of Colorado, Aurora, CO 80045 USA.
References
- [1].Desmedt JE, Clinical Uses of Cerebral, Brainstem, and Spinal Somatosensory Evoked Potentials. Basel, Switzerland: Karger, 1980. [Google Scholar]
- [2].Cruccu G et al. , “Recommendations for the clinical use of somatosensory-evoked potentials,” Clin. Neurophysiol, vol. 119, no. 8, pp. 1705–1719, Aug. 2008. [DOI] [PubMed] [Google Scholar]
- [3].Chiappa KH, Evoked Potentials in Clinical Medicine. Philadelphia, PA, USA: Lippincott Williams & Wilkins, 1997. [Google Scholar]
- [4].Nuwer MR, “Fundamentals of evoked potentials and common clinical applications today,” Electroencephalogr. Clin. Neurophysiol, vol. 106, no. 2, pp. 142–148, 1998. [DOI] [PubMed] [Google Scholar]
- [5].Kim D-H et al. , “Epidermal electronics,” Science, vol. 333, no. 6044, pp. 838–843, Aug. 2011. [DOI] [PubMed] [Google Scholar]
- [6].Norton JJS et al. , “Soft, curved electrode systems capable of integration on the auricle as a persistent brain–computer interface,” Proc. Nat. Acad. Sci. USA, vol. 112, no. 13, pp. 3920–3925, Mar. 2015. [DOI] [PMC free article] [PubMed] [Google Scholar]
- [7].Xu B et al. , “An epidermal stimulation and sensing platform for sensorimotor prosthetic control, management of lower back exertion, and electrical muscle activation,” Adv. Mater, vol. 28, no. 22, pp. 4462–4471, Jun. 2016. [DOI] [PMC free article] [PubMed] [Google Scholar]
- [8].Ying M et al. , “Silicon nanomembranes for fingertip electronics,” Nanotechnology, vol. 23, no. 34, Aug. 2012, Art. no. 344004. [DOI] [PubMed] [Google Scholar]
- [9].Jeong J-W et al. , “Materials and optimized designs for human-machine interfaces via epidermal electronics,” Adv. Mater, vol. 25, no. 47, pp. 6839–6846, Dec. 2013. [DOI] [PubMed] [Google Scholar]
- [10].Son D et al. , “Multifunctional wearable devices for diagnosis and therapy of movement disorders,” Nature Nanotechnol, vol. 9, no. 5, pp. 397–404, Mar. 2014. [DOI] [PubMed] [Google Scholar]
- [11].Kang D et al. , “Scalable microfabrication procedures for adhesive-integrated flexible and stretchable electronic sensors,” Sensors, vol. 15, no. 9, pp. 23459–23476, 2015. [DOI] [PMC free article] [PubMed] [Google Scholar]
- [12].Gil-da-Costa R et al. , “A novel method to assess event-related brain potentials in clinical domains using frontal epidermal electronics sensors,” 2013. Abstract Viewer/Itinerary Planner. San Diego, CA: Society for Neuroscience. [Google Scholar]
- [13].Coleman TP et al. , “Epidermal electronics capture of event-related brain potentials in a real-world target detection task,” 2012. Abstract Viewer/Itinerary Planner. New Orleans, LA: Society for Neuroscience. [Google Scholar]
- [14].Harbert MJ et al. , “Demonstration of the use of epidermal electronics in neurological monitoring,” in Annals of Neurology. Hoboken, NJ, USA: Wiley-Blackwell, 2013. [Google Scholar]
- [15].Fisher J et al. , “Real-time detection and monitoring of acute brain injury utilizing evoked electroencephalographic potentials,” IEEE Trans. Neural Syst. Rehabil. Eng, vol. 24, no. 9, pp. 1003–1012, Sep. 2016. [DOI] [PMC free article] [PubMed] [Google Scholar]
- [16].Zhou Y et al. , “Measurement of high intensity focused ultrasound fields by a fiber optic probe hydrophone,” J. Acoust. Soc. Amer, vol. 120, no. 2, pp. 676–685, 2006. [DOI] [PMC free article] [PubMed] [Google Scholar]
- [17].King RL et al. , “Effective parameters for ultrasound-induced in vivo neurostimulation,” Ultrasound Med. Biol, vol. 39, no. 2, pp. 312–331, Feb. 2013. [DOI] [PubMed] [Google Scholar]
- [18].Durduran T et al. , “Spatiotemporal quantification of cerebral blood flow during functional activation in rat somatosensory ortex using laser-speckle flowmetry,” J. Cerebral Blood Flow Metabolism vol. 24, no. 5, pp. 518–525, 2004. [DOI] [PubMed] [Google Scholar]
- [19].Lueders H et al. , “Cortical somatosensory evoked potentials in response to hand stimulation,” J. Neurosurg, vol. 58, no. 6, pp. 885–894, Jun. 1983. [DOI] [PubMed] [Google Scholar]
- [20].Ibáñez V et al. , “Effects of stimulus rate on regional cerebral blood flow after median nerve stimulation,” Brain, vol. 118, no. 5, pp. 1339–1351, 1995. [DOI] [PubMed] [Google Scholar]
- [21].Fujii M et al. , “The effects of stimulus rates upon median, ulnar and radial nerve somatosensory evoked potentials,” Electroencephalogr. Clin. Neurophysiol, vol. 92, no. 6, pp. 518–526, Nov. 1994. [DOI] [PubMed] [Google Scholar]
- [22].Ngai AC et al. , “Frequency-dependent changes in cerebral blood flow and evoked potentials during somatosensory stimulation in the rat,” Brain Res, vol. 837, no. 1, pp. 221–228, 1999. [DOI] [PubMed] [Google Scholar]
- [23].McCabe JT et al. , “Application of high-intensity focused ultrasound to the study of mild traumatic brain injury,” Ultrasound Med. Biol, vol. 40, no. 5, pp. 965–978, May 2014. [DOI] [PubMed] [Google Scholar]
- [24].Yu K, “Electrophysiological source imaging of brain networks perturbed by low-intensity transcranial focused ultrasound,” IEEE Trans. Biomed. Eng, vol. 63, no. 9, pp. 1787–1794, Sep. 2016. [DOI] [PMC free article] [PubMed] [Google Scholar]
- [25].Chung I et al. , “Upper-limb somatosensory evoked potential monitoring in lumbosacral spine surgery: A prognostic marker for position-related ulnar nerve injury,” Spine J, vol. 9, no. 4, pp. 287–295, Apr. 2009. [DOI] [PubMed] [Google Scholar]
- [26].Deletis V and Sala F, “Intraoperative neurophysiological monitoring of the spinal cord during spinal cord and spine surgery: A review focus on the corticospinal tracts,” Clin. Neurophysiol, vol. 119, no. 2, pp. 248–264, Feb. 2008. [DOI] [PubMed] [Google Scholar]
- [27].Pickell M et al. , “Surgeon-driven neurophysiologic monitoring in a spinal surgery population,” J. Spine Surg, vol. 2, no. 3, pp. 173–177, Sep. 2016. [DOI] [PMC free article] [PubMed] [Google Scholar]
- [28].Zhang Y et al. , “Predicting comatose patients with acute stroke outcome using middle-latency somatosensory evoked potentials,” Clin. Neurophysiol.., vol. 122, no. 8, pp. 1645–1649, Aug. 2011. [DOI] [PubMed] [Google Scholar]
- [29].Bouwes A et al. , “Predictive value of neurological examination for early cortical responses to somatosensory evoked potentials in patients with postanoxic coma,” J. Neurol, vol. 259, no. 3, pp. 537–541, Mar. 2012. [DOI] [PMC free article] [PubMed] [Google Scholar]
- [30].Hofmeijer J et al. , “Early EEG contributes to multimodal outcome prediction of postanoxic coma,” Neurology, vol. 85, no. 2, pp. 137–143, Jul. 2015. [DOI] [PMC free article] [PubMed] [Google Scholar]
- [31].Koenig MA and Kaplan PW, “Clinical applications for EPs in the ICU,” J. Clin. Neurophysiol, vol. 32, no. 6, pp. 472–480, Dec. 2015. [DOI] [PubMed] [Google Scholar]
- [32].Zhang Y et al. , “Somatosensory and brainstem auditory evoked potentials assessed between 4 and 7 days after severe stroke onset predict unfavorable outcome,” Biomed. Res. Int, vol. 2015, 2015, Art. no. 196148. [DOI] [PMC free article] [PubMed] [Google Scholar]
- [33].Endisch C et al. , “Amplitudes of SSEP and outcome in cardiac arrest survivors: A prospective cohort study,” Neurology, vol. 85, no. 20, pp. 1752–1760, Nov. 2015. [DOI] [PubMed] [Google Scholar]
- [34].Endisch C et al. , “Cortical somatosensory evoked high-frequency (600Hz) oscillations predict absence of severe hypoxic encephalopathy after resuscitation,” Clin. Neurophysiol, vol. 127, no. 7, pp. 2561–2569, Jul. 2016. [DOI] [PubMed] [Google Scholar]
- [35].Giffroy X et al. , “Multimodal evoked potentials for functional quantification and prognosis in multiple sclerosis,” BMC Neurol., vol. 16, Jun. 2016, Art. no. 83. [DOI] [PMC free article] [PubMed] [Google Scholar]
- [36].Magnano I et al. , “Comparison of brainstem reflex recordings and evoked potentials with clinical and MRI data to assess brainstem dysfunction in multiple sclerosis: A short-term follow-up,” Neurol. Sci, vol. 37, no. 9, pp. 1457–1465, Sep. 2016. [DOI] [PubMed] [Google Scholar]
- [37].Thatcher RW et al. , “An EEG severity index of traumatic brain injury,” J. Neuropsychiatry Clin. Neurosci, vol. 13, pp. 77–87, 2001. [DOI] [PubMed] [Google Scholar]
- [38].Tyler WJ, “Noninvasive neuromodulation with ultrasound? A continuum mechanics hypothesis,” Neuroscientist, vol. 17, no. 1, pp. 25–36, Feb. 2011. [DOI] [PubMed] [Google Scholar]
- [39].Choi JJ et al. , “Noninvasive, transcranial and localized opening of the blood-brain barrier using focused ultrasound in mice,” Ultrasound Med. Biol, vol. 33, no. 1, pp. 95–104, Jan. 2007. [DOI] [PubMed] [Google Scholar]
- [40].McCabe JT et al. , “Animal models for the study of military-related, blast-induced traumatic brain injury,” in Proc. 2010 Biomed. Scie. Eng. Conf., 2010, pp. 1–4. [Google Scholar]
- [41].American Clinical Neurophysiology Society, “Guideline 9D: Guidelines on short-latency somatosensory evoked potentials,” J. Clin. Neurophysiol, vol. 23, pp. 168–179, 2006. [DOI] [PubMed] [Google Scholar]


