
Fig. 10.
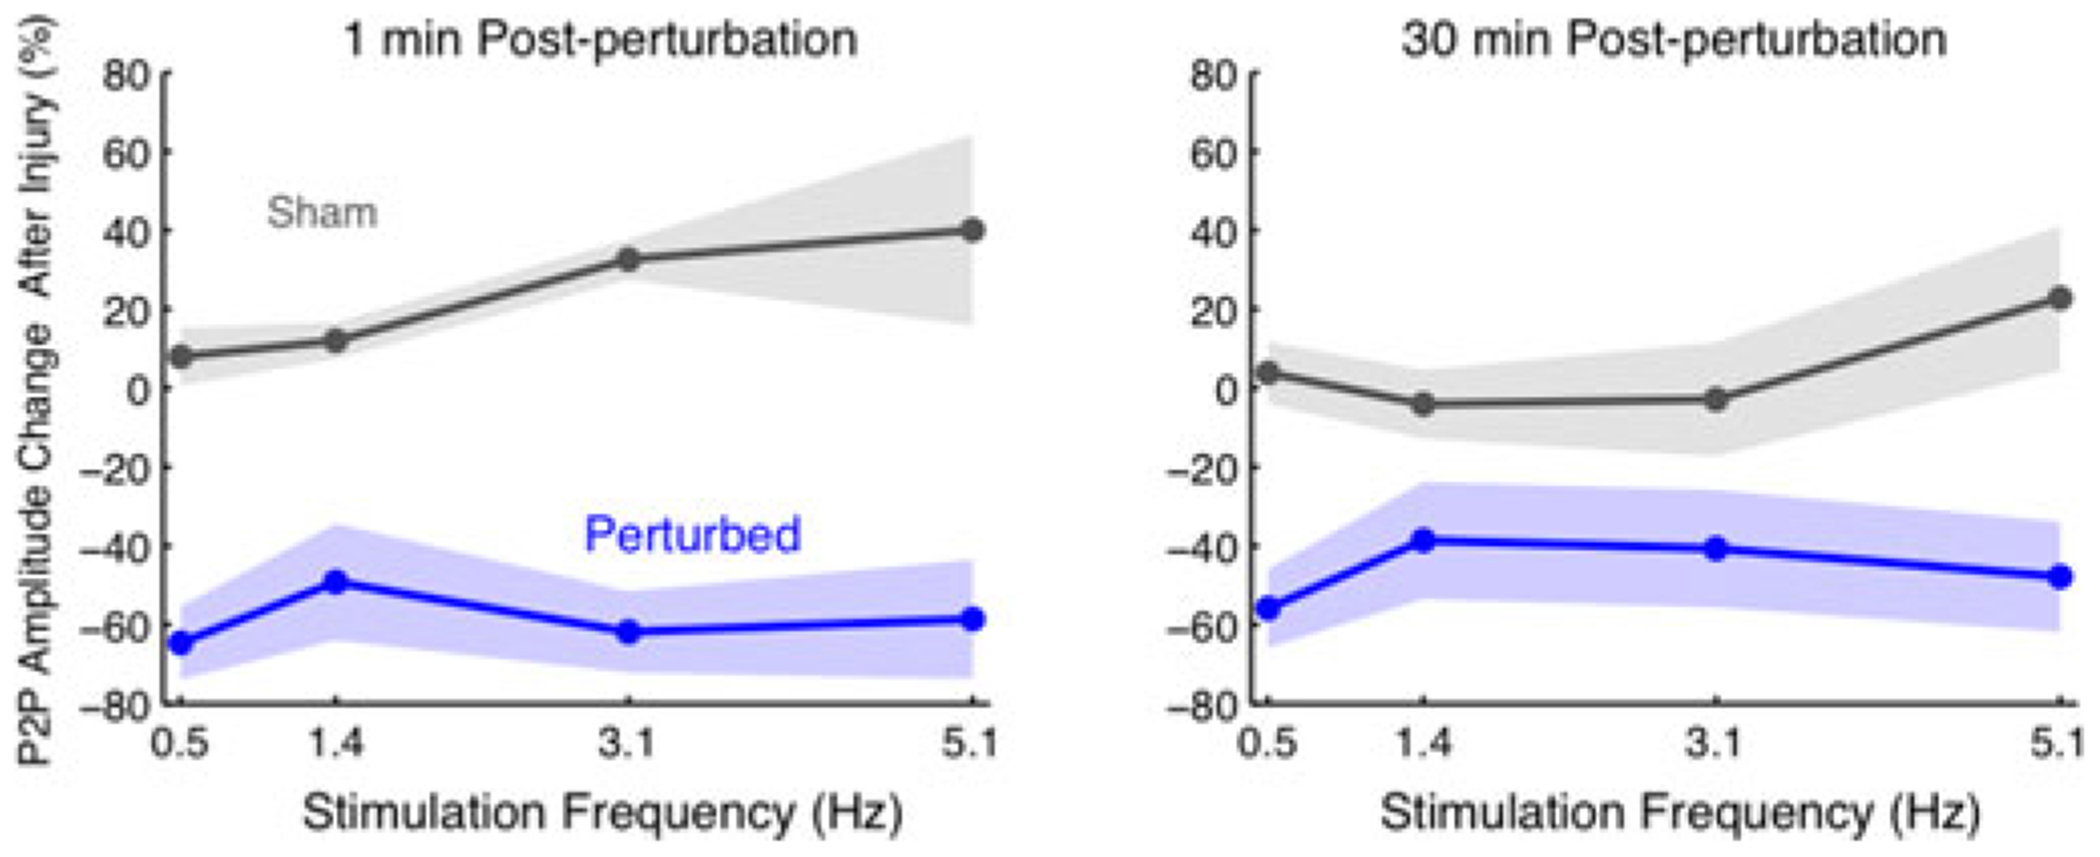
Post-perturbation changes in peak-to-peak amplitudes and P1 latencies. The shaded region represents the standard error of the mean. (Perturbed N = 14; Sham N = 8.) Amplitudes exhibited on average a 50% to 60% reduction across all frequencies, immediately following an acute perturbation and a gradual recovery. Latencies however did not appear to change significantly (data not shown).