
Fig. 8.
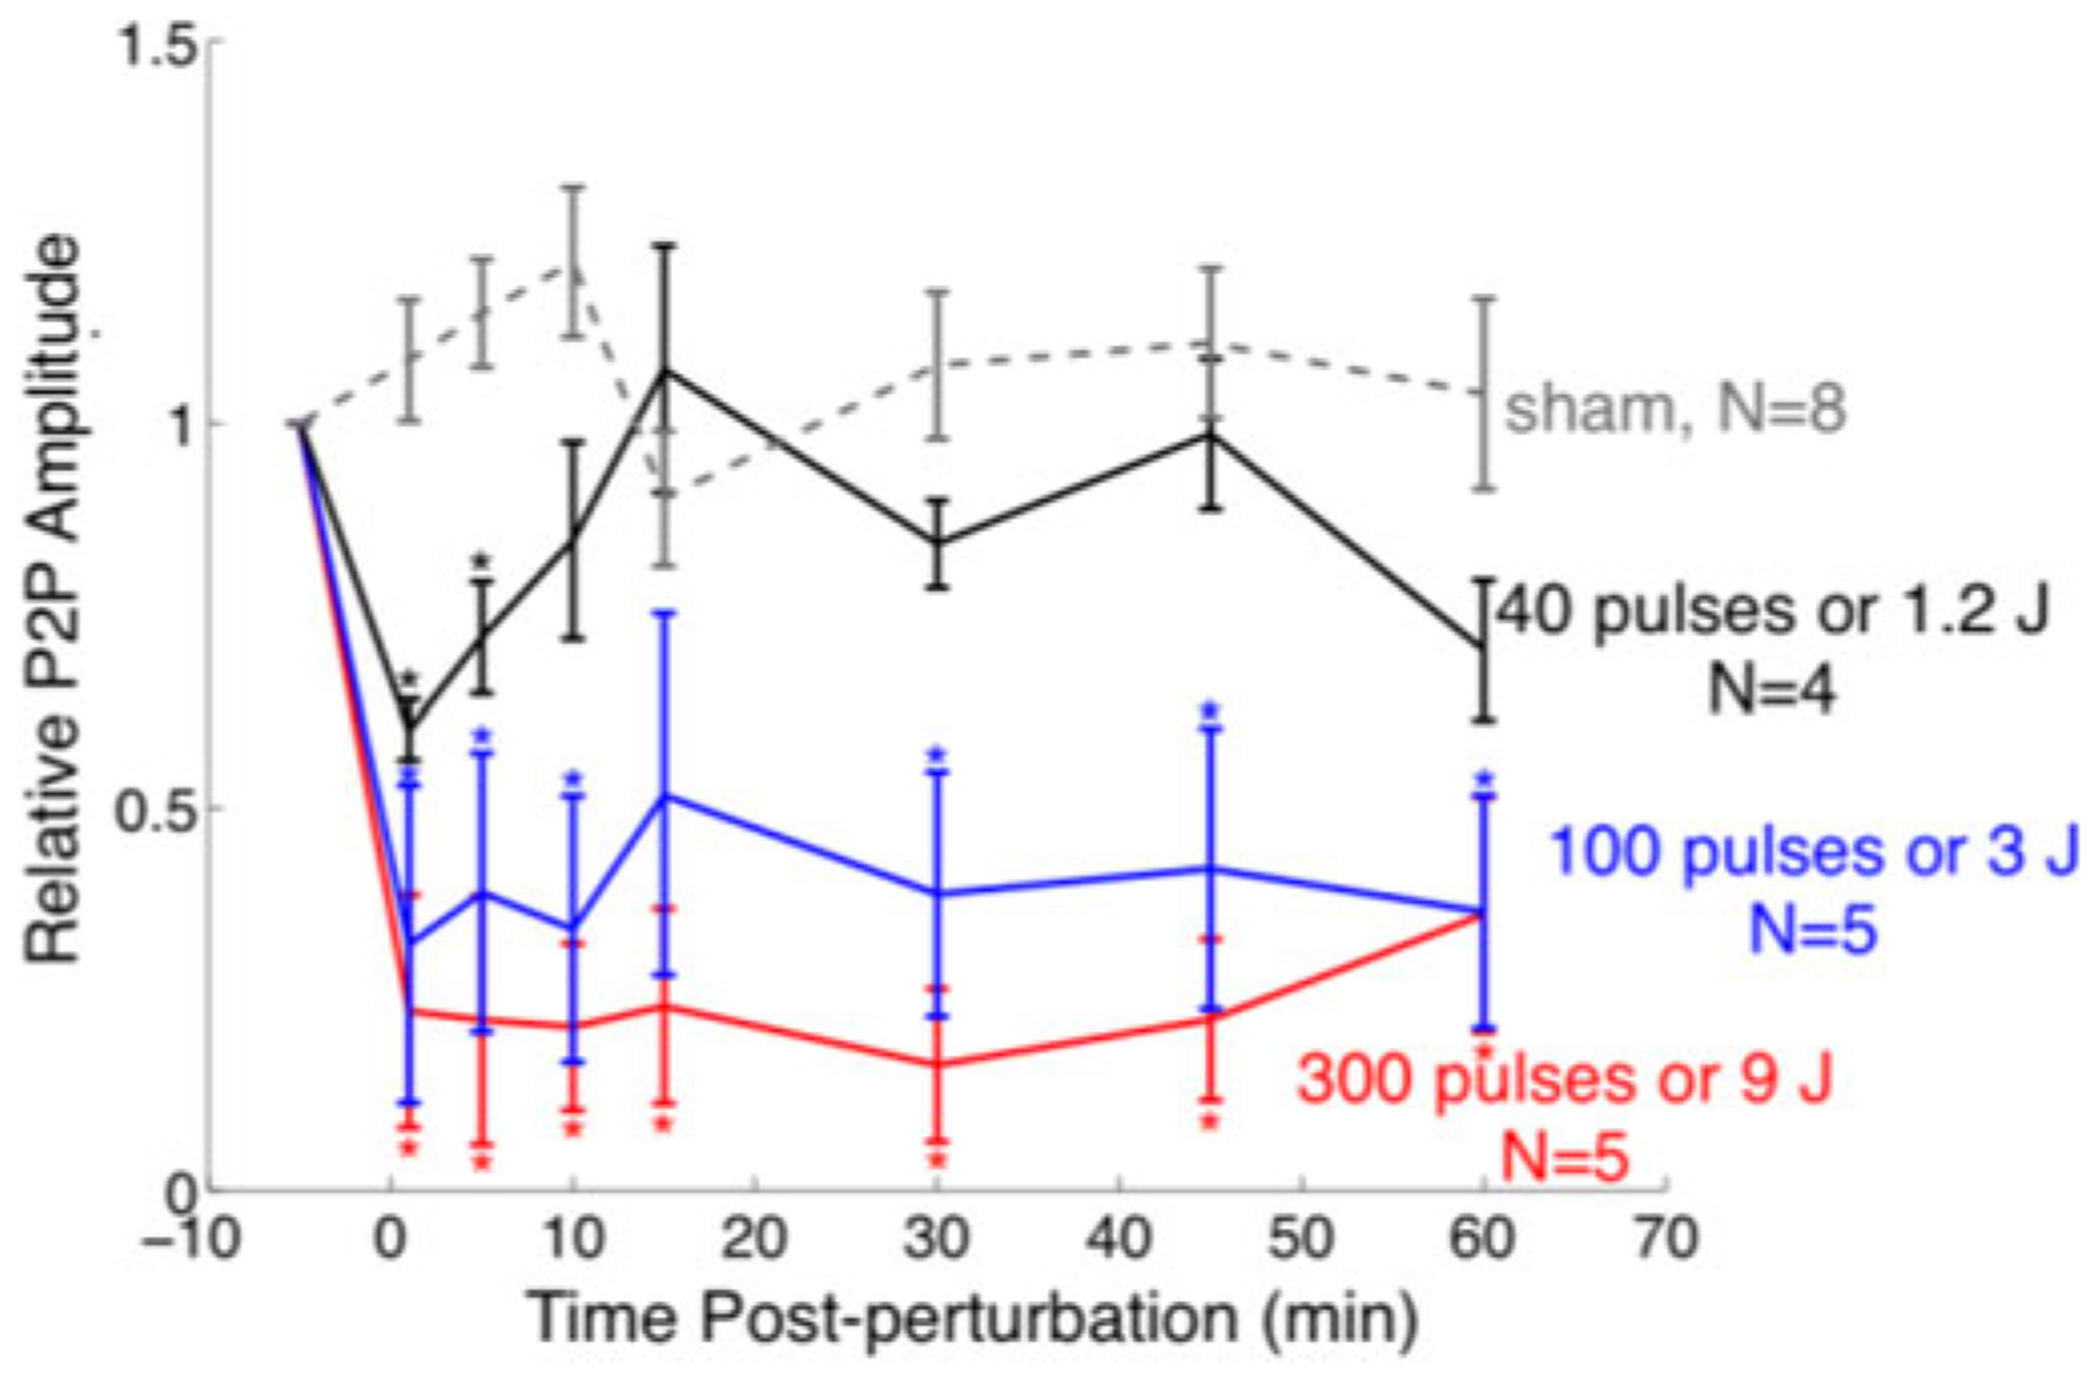
Dose-response of ultrasonic perturbation. A time course of SSEP Peak-to-peak amplitude change before and after an acute brain perturbation produced by 0 (sham), 1.2, 3 and 9 J or 0 (sham), 40, 100 and 300 pulses of ultrasound exposure. Error bars represent standard error. * denotes the relative P2P amplitudes that were significantly different (two-tailed Student’s t-test, P < 0.05) from those of sham at each time point. Significance: Flexible epidermal electrode recordings were sensitive to different levels of severity of brain perturbation produced by graded ultrasound exposure.