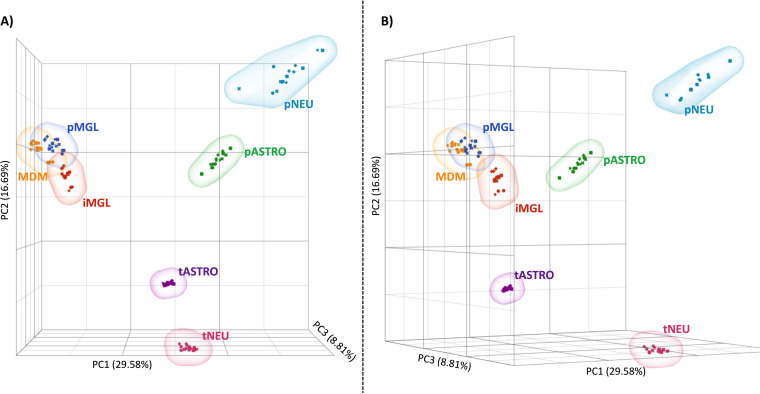
FIG 7.
Myeloid-derived cells express similar transcriptomes, but astrocyte and neurons differ significantly by cell type and model. A principal-component analysis (PCA) was generated in Partek Flow using all normalized reads from treated and nontreated pMGL (blue), iMGL (red), MDM (yellow), tASTRO (purple), pASTRO (green), tNEU (pink), and pNEU (teal). Individual replicates for treated (IFN1, squares; IFN2, crosses; LPS1, Xs; LPS2, stars) and nontreated (circles) are displayed for each cell type. Total variance comprised by vector is listed on the correlating axis. (A and B) PC1 versus PC2 is best visualized in a head-on view (A) whereas rotation of the three-vector plot reveals the influence of PC3 (B).

