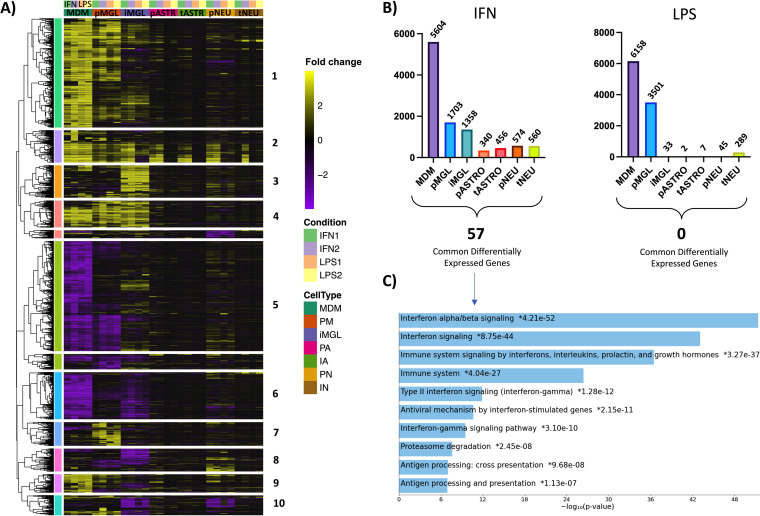
FIG 8.
CNS cell types demonstrate nonuniform responses to IFN- and LPS-mediated inflammation. (A) Hierarchical clustering was performed using on the log2 fold change of genes across all treatments. Fold changes compared to nontreated samples (upregulation, yellow; downregulation, purple) are listed for each gene across all cell types. Treatment groups include IFN1 (10 ng/mL; green), IFN2 (100 ng/mL; purple), LPS1 (10 ng/mL; orange), and LPS2 (100 ng/mL; yellow). Only genes with a padj of <0.05 and fold change of ±4 in at least one analysis were included. Cluster distances are based on correlation distance with complete linkage. (B) Total differentially expressed genes (padj < 0.05, fold change of ±2) in response to IFN2 and LPS2 are plotted for each cell type. Differentially expressed genes shared between all cell types are listed below the histograms (LPS, 0; IFN, 57). (C) Gene pathway enrichment analysis was performed using Enrichr for the 57 genes commonly differentially expressed across all cell types in response to 100 ng/mL IFN. Log10 P values representing the strength of correlation are listed for each pathway.

