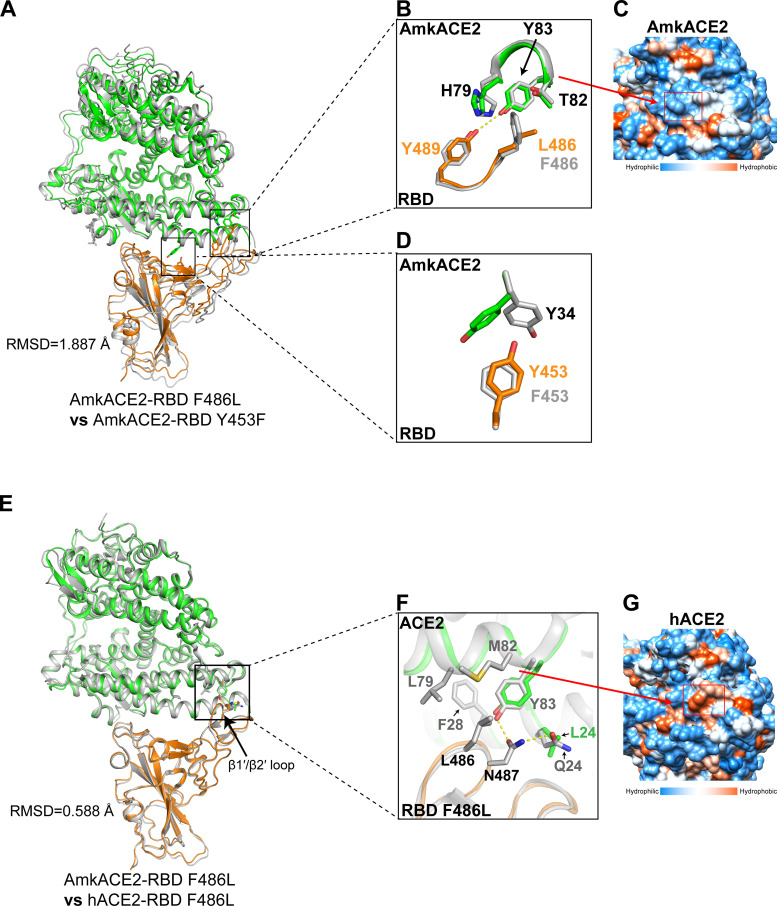
FIG 4.
Structural comparison of AmkACE2-RBD F486L and AmkACE2-RBD Y453F or hACE2-RBD F486L. (A) Superimposition of AmkACE2-RBD F486L and AmkACE2-RBD Y453F. The RMSD is shown. AmkACE2 and RBD F486L in the AmkACE2-RBD F486L structure are colored green and orange, respectively. AmkACE2-RBD Y453F is colored gray. (B) AmkACE2 H79-Y83 and RBD F/L486-Y489 in both structures are superimposed. AmkACE2 H79, T82, and Y83, RBD F/L486, and Y489 are shown as sticks and labeled. Hydrogen bond interaction was analyzed at a cutoff of 3.5 Å and is colored in yellow. (C) The structure of AmkACE2 shows hydrophilic (blue) surfaces on the RBD binding face. A red rectangle indicates the surface of H79-Y83. Molecular surfaces are colored according to hydrophobicity, with blue, white, and orange corresponding to the most hydrophilic, neutral, and hydrophobic patches, respectively. (D) AmkACE2 Y34 and RBD Y/F453 in both structures are superimposed. AmkACE2 Y34 and RBD Y/F453 are shown as sticks and labeled. (E) Superimposition of AmkACE2-RBD F486L and hACE2-RBD F486L (PDB 7EKE). The RMSD and β1′/β2′ loop are shown. AmkACE2 and RBD F486L in the AmkACE2-RBD F486L structure are colored in green and orange, respectively. hACE2-RBD F486L is colored in gray. (F) ACE2 Q/L24, F28, L79, M82, and Y83, RBD L486 and N487 are shown as sticks and labeled. Hydrogen bond interaction was analyzed at a cutoff of 3.5 Å and colored in yellow. (G) The structure of hACE2 shows hydrophobic (orange) surfaces on the RBD-binding face. A red rectangle indicates the surface of F28, L79, and M82. Molecular surfaces are colored according to their hydrophobicity, with blue, white, and orange corresponding to the most hydrophilic, neutral, and hydrophobic regions, respectively.

