FIG 2.
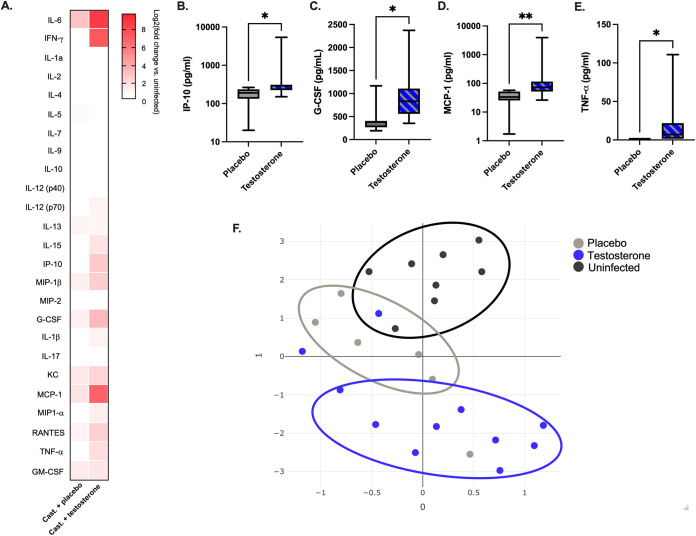
Testosterone promotes proinflammatory cytokines and chemokines in response to CVB3. Infected mice were orally inoculated with 5 × 10⁷ PFU of CVB3-Nancy, and serum was collected at 3 dpi. (A) Heat map of the serum levels of the indicated cytokines or chemokines at 3 dpi between CVB3-infected, testosterone-depleted and testosterone-treated male Ifnar−/− mice. The log2-fold change was normalized to uninfected mice. (B−E) The serum concentration of indicated cytokines and chemokines from infected mice. The serum concentration for each cytokine is represented by a box and whisker plot. The box represents the 25th through 75th percentiles of the data, and the center line in the box represents the median value. The black whiskers mark the 5th and 95th percentiles of the data. *, P < 0.05, **, P < 0.01, ***, P < 0.001; Kruskal-Wallis test. (F) Uniform manifold approximation and projection (UMAP) analysis of chemokine and cytokine serum concentrations in uninfected (black circles), testosterone-depleted (gray circles), and testosterone-treated (blue circles) male Ifnar−/− mice. Data are representative of two independent experiments with n = 7 to 11 mice per group.

