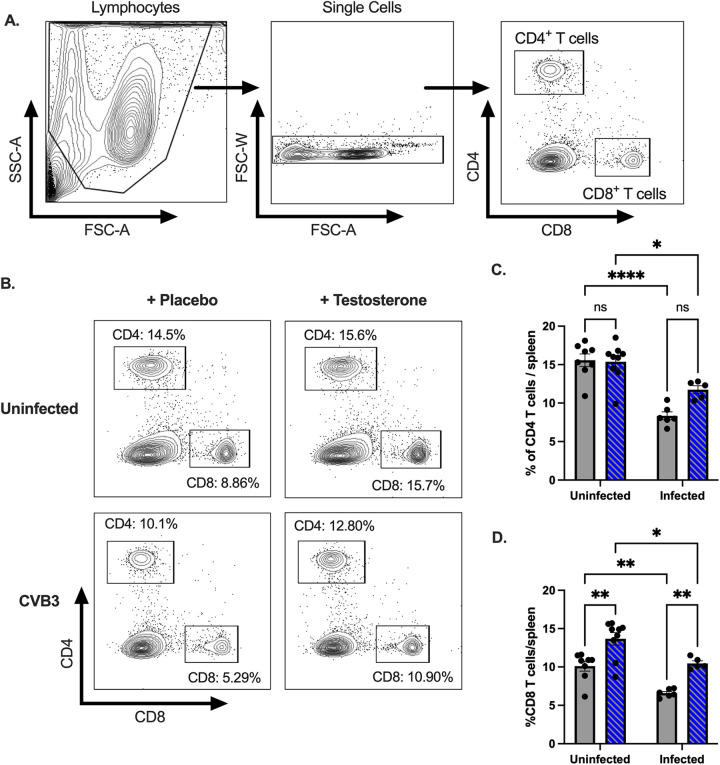
FIG 4.
CVB3 and testosterone impact the proportions of splenic CD4+ and CD8+ T cells following oral inoculation. (A) Representative gating strategies by which to identify CD4+ and CD8+ T cells. (B) Representative flow cytometry plots of CD4+ and CD8+ T cells in uninfected and infected mice that are either testosterone-treated or testosterone-depleted (placebo). (C) The frequency of CD4+ T cells in the spleen in testosterone-treated (blue with diagonal lines) and testosterone-depleted (gray) mice. (D) The frequency of CD8+ T cells in the spleen in testosterone-treated (blue with diagonal lines) and testosterone-depleted (gray) mice. *, P < 0.05, **, P < 0.01, ****, P < 0.0001; two-way ANOVA. All data are from two independent experiments with n = 4 to 6 mice per group and are shown as mean ± SEM.

