. 2022 Sep 14;130(9):097003. doi: 10.1289/EHP10923

Figure 10.

Figure 10A is a Gene Set Enrichment Analysis plot titled Enrichment plot: White matter myelin axons, plotting enrichment score (E S), ranging from 0.0 to 0.6 in increments of 0.1 and Ranked list metric (difference of classes), ranging from negative 4 to 2 in unit increments (y-axis) across Rank in ordered data set, ranging from 0 to 14,000 in increments of 2,000 (x-axis) for enrichment profile, hits, and ranking metric scores. Figure 10B is a set of two stained tissues titled Vehicle Control and Domoic Acid, depicting Luxol fast blue staining for myelin in the hippocampus in animals. Figure 10C is a tabular representation with five rows and four columns, namely, Gene, log to the base 2 of fold change, lowercase p value, and lowercase q value. Row 1: Kallikrein related peptidase 6, 0.71, 0.003, and 0.27. Row 2: Myelin associated glycoprotein, 0.68, less than 0.001, and 0.05. Row 3: Galactose-3-O-sulfotransferase 1, 0.65, 0.4, and 0.67. Row 4: Myelin and Lymphocyte protein, 0.63, 0.006, and 0.34. Row 5: Neuregulin 1, negative 0.63, 0.02, and 0.53.

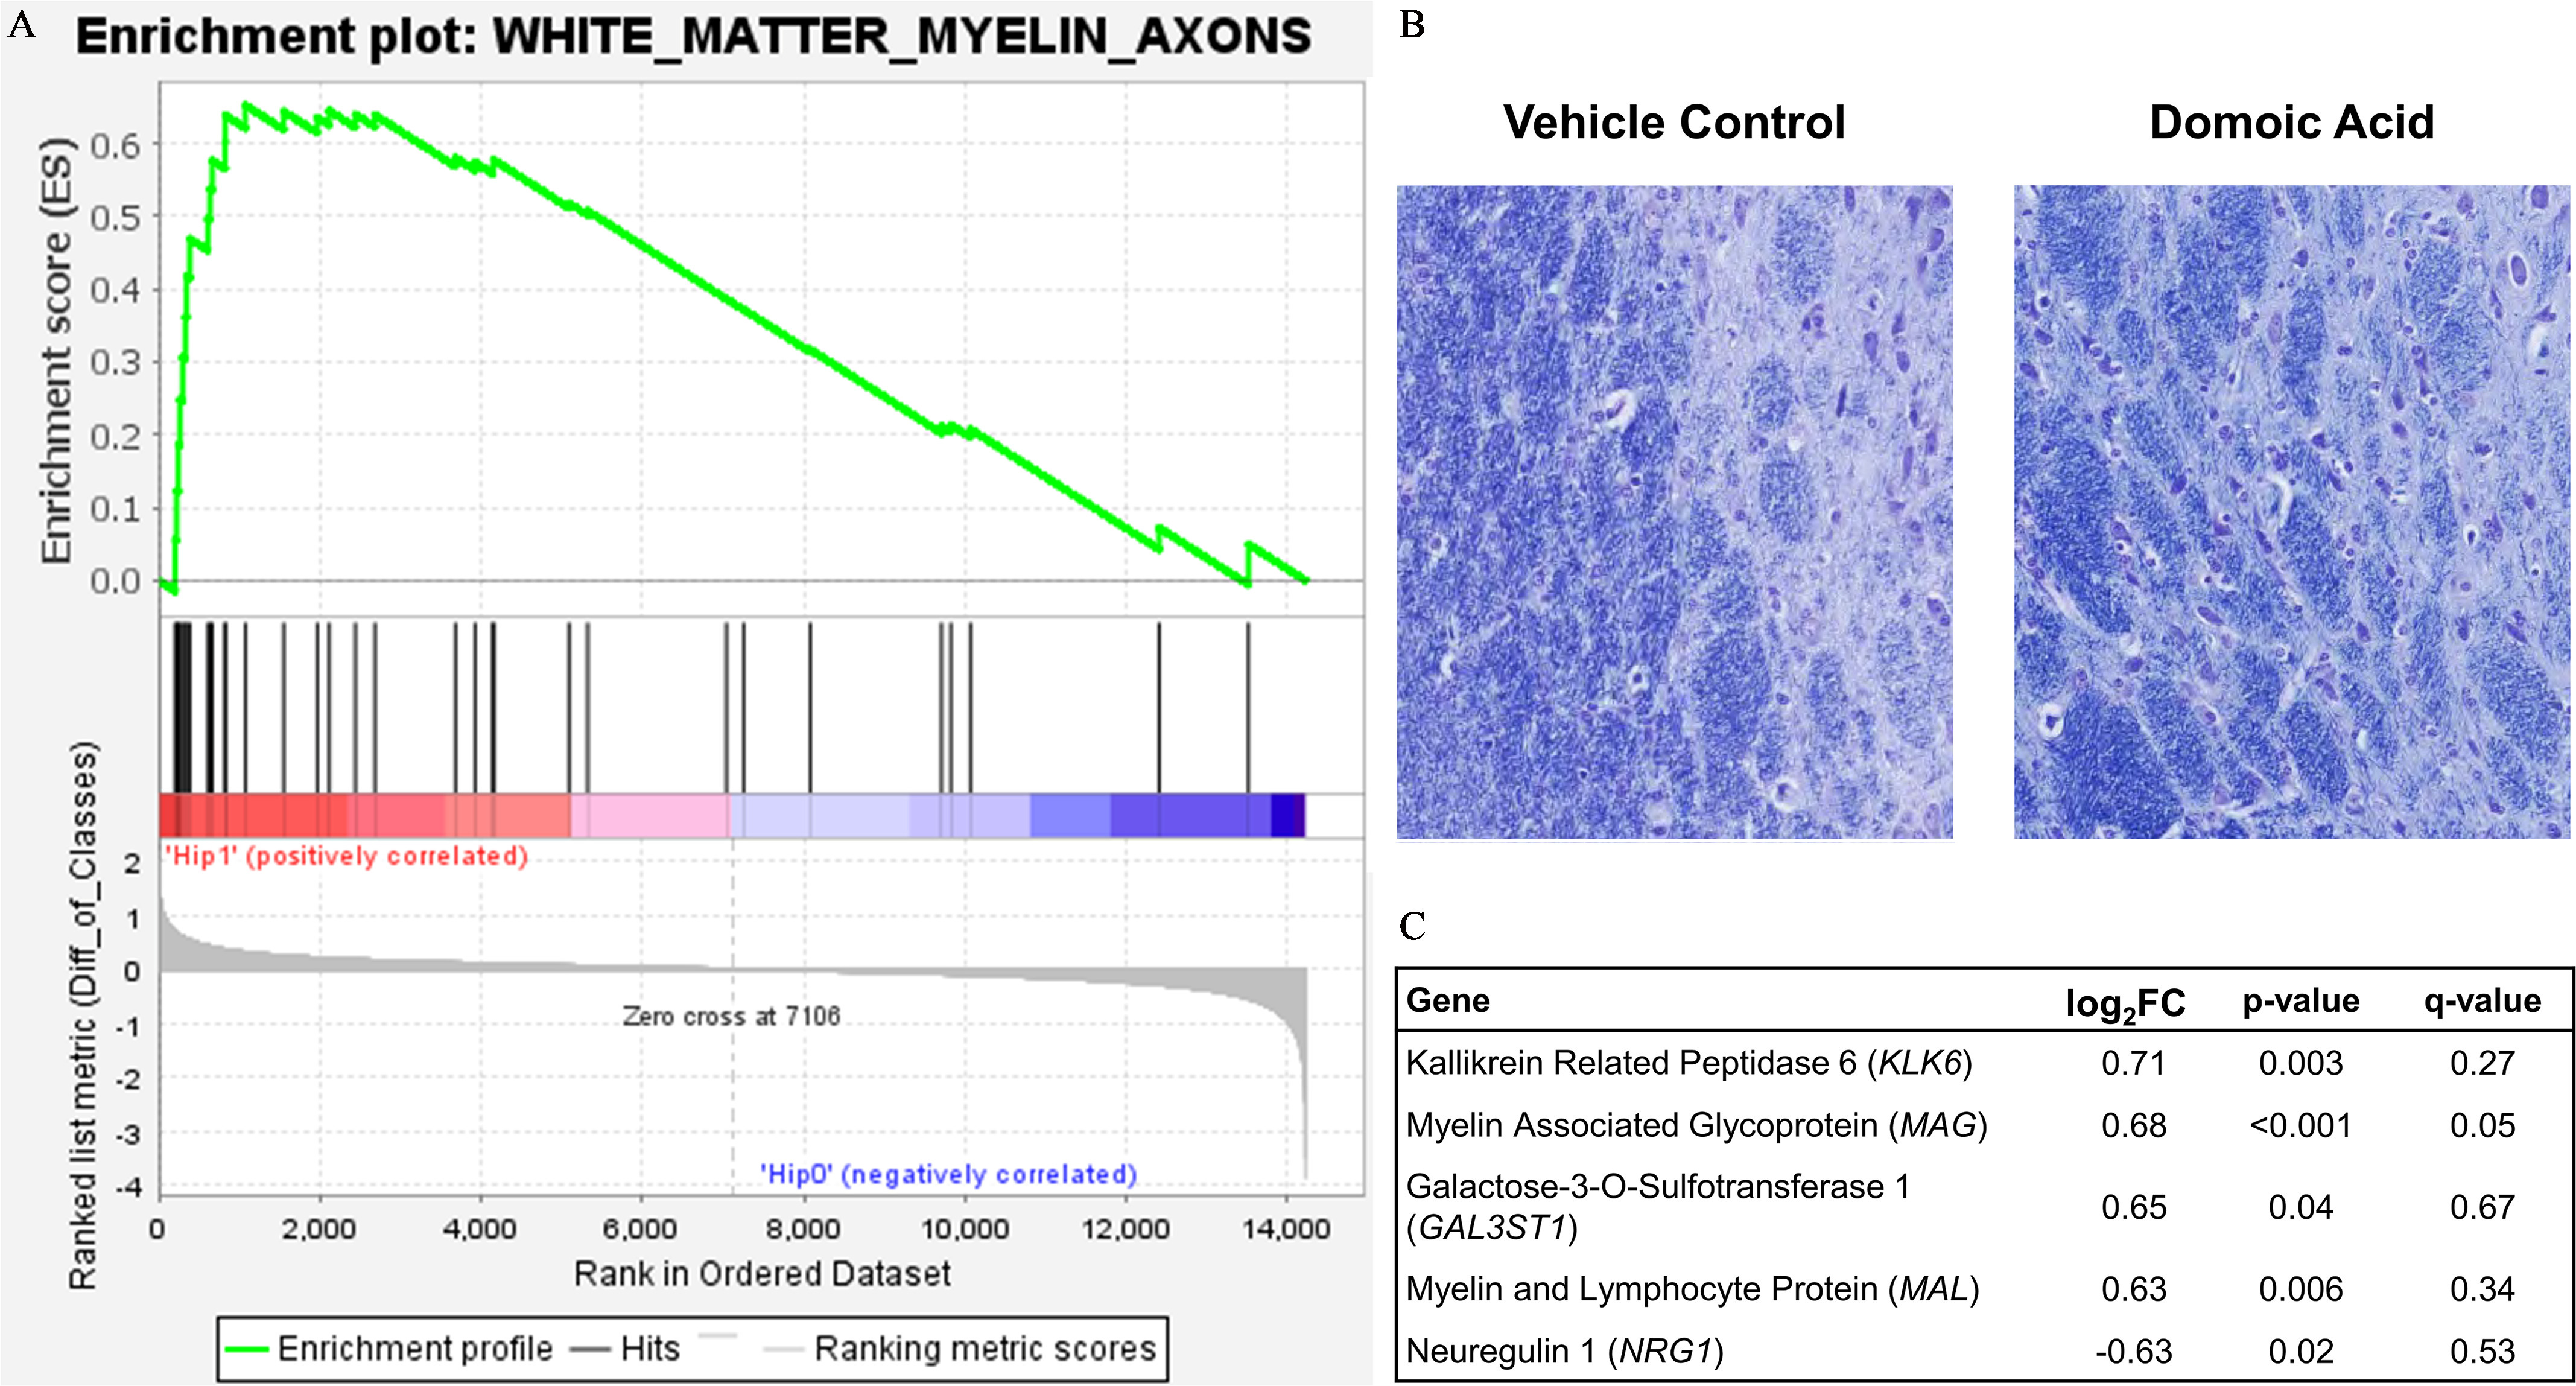
White matter response to domoic acid. (A) Gene Set Enrichment Analysis (GSEA) plot. The enrichment profile across all genes in that set from GSEA is shown in the upper panel curve, with the significant genes demarked underneath by black vertical lines and a scale representing genes up-regulated on the left (red) to those down-regulated on the right side (blue) of the panel. (B) Representation image of Luxol fast blue (LFB) staining for myelin in the hippocampus of vehicle control and domoic acid-exposed animals. (C) Significantly differentially expressed genes from the white matter GSEA list by log2 FC. Note: Diff, difference; FC, fold change.