. 2022 Sep 14;130(9):097003. doi: 10.1289/EHP10923

Figure 9.

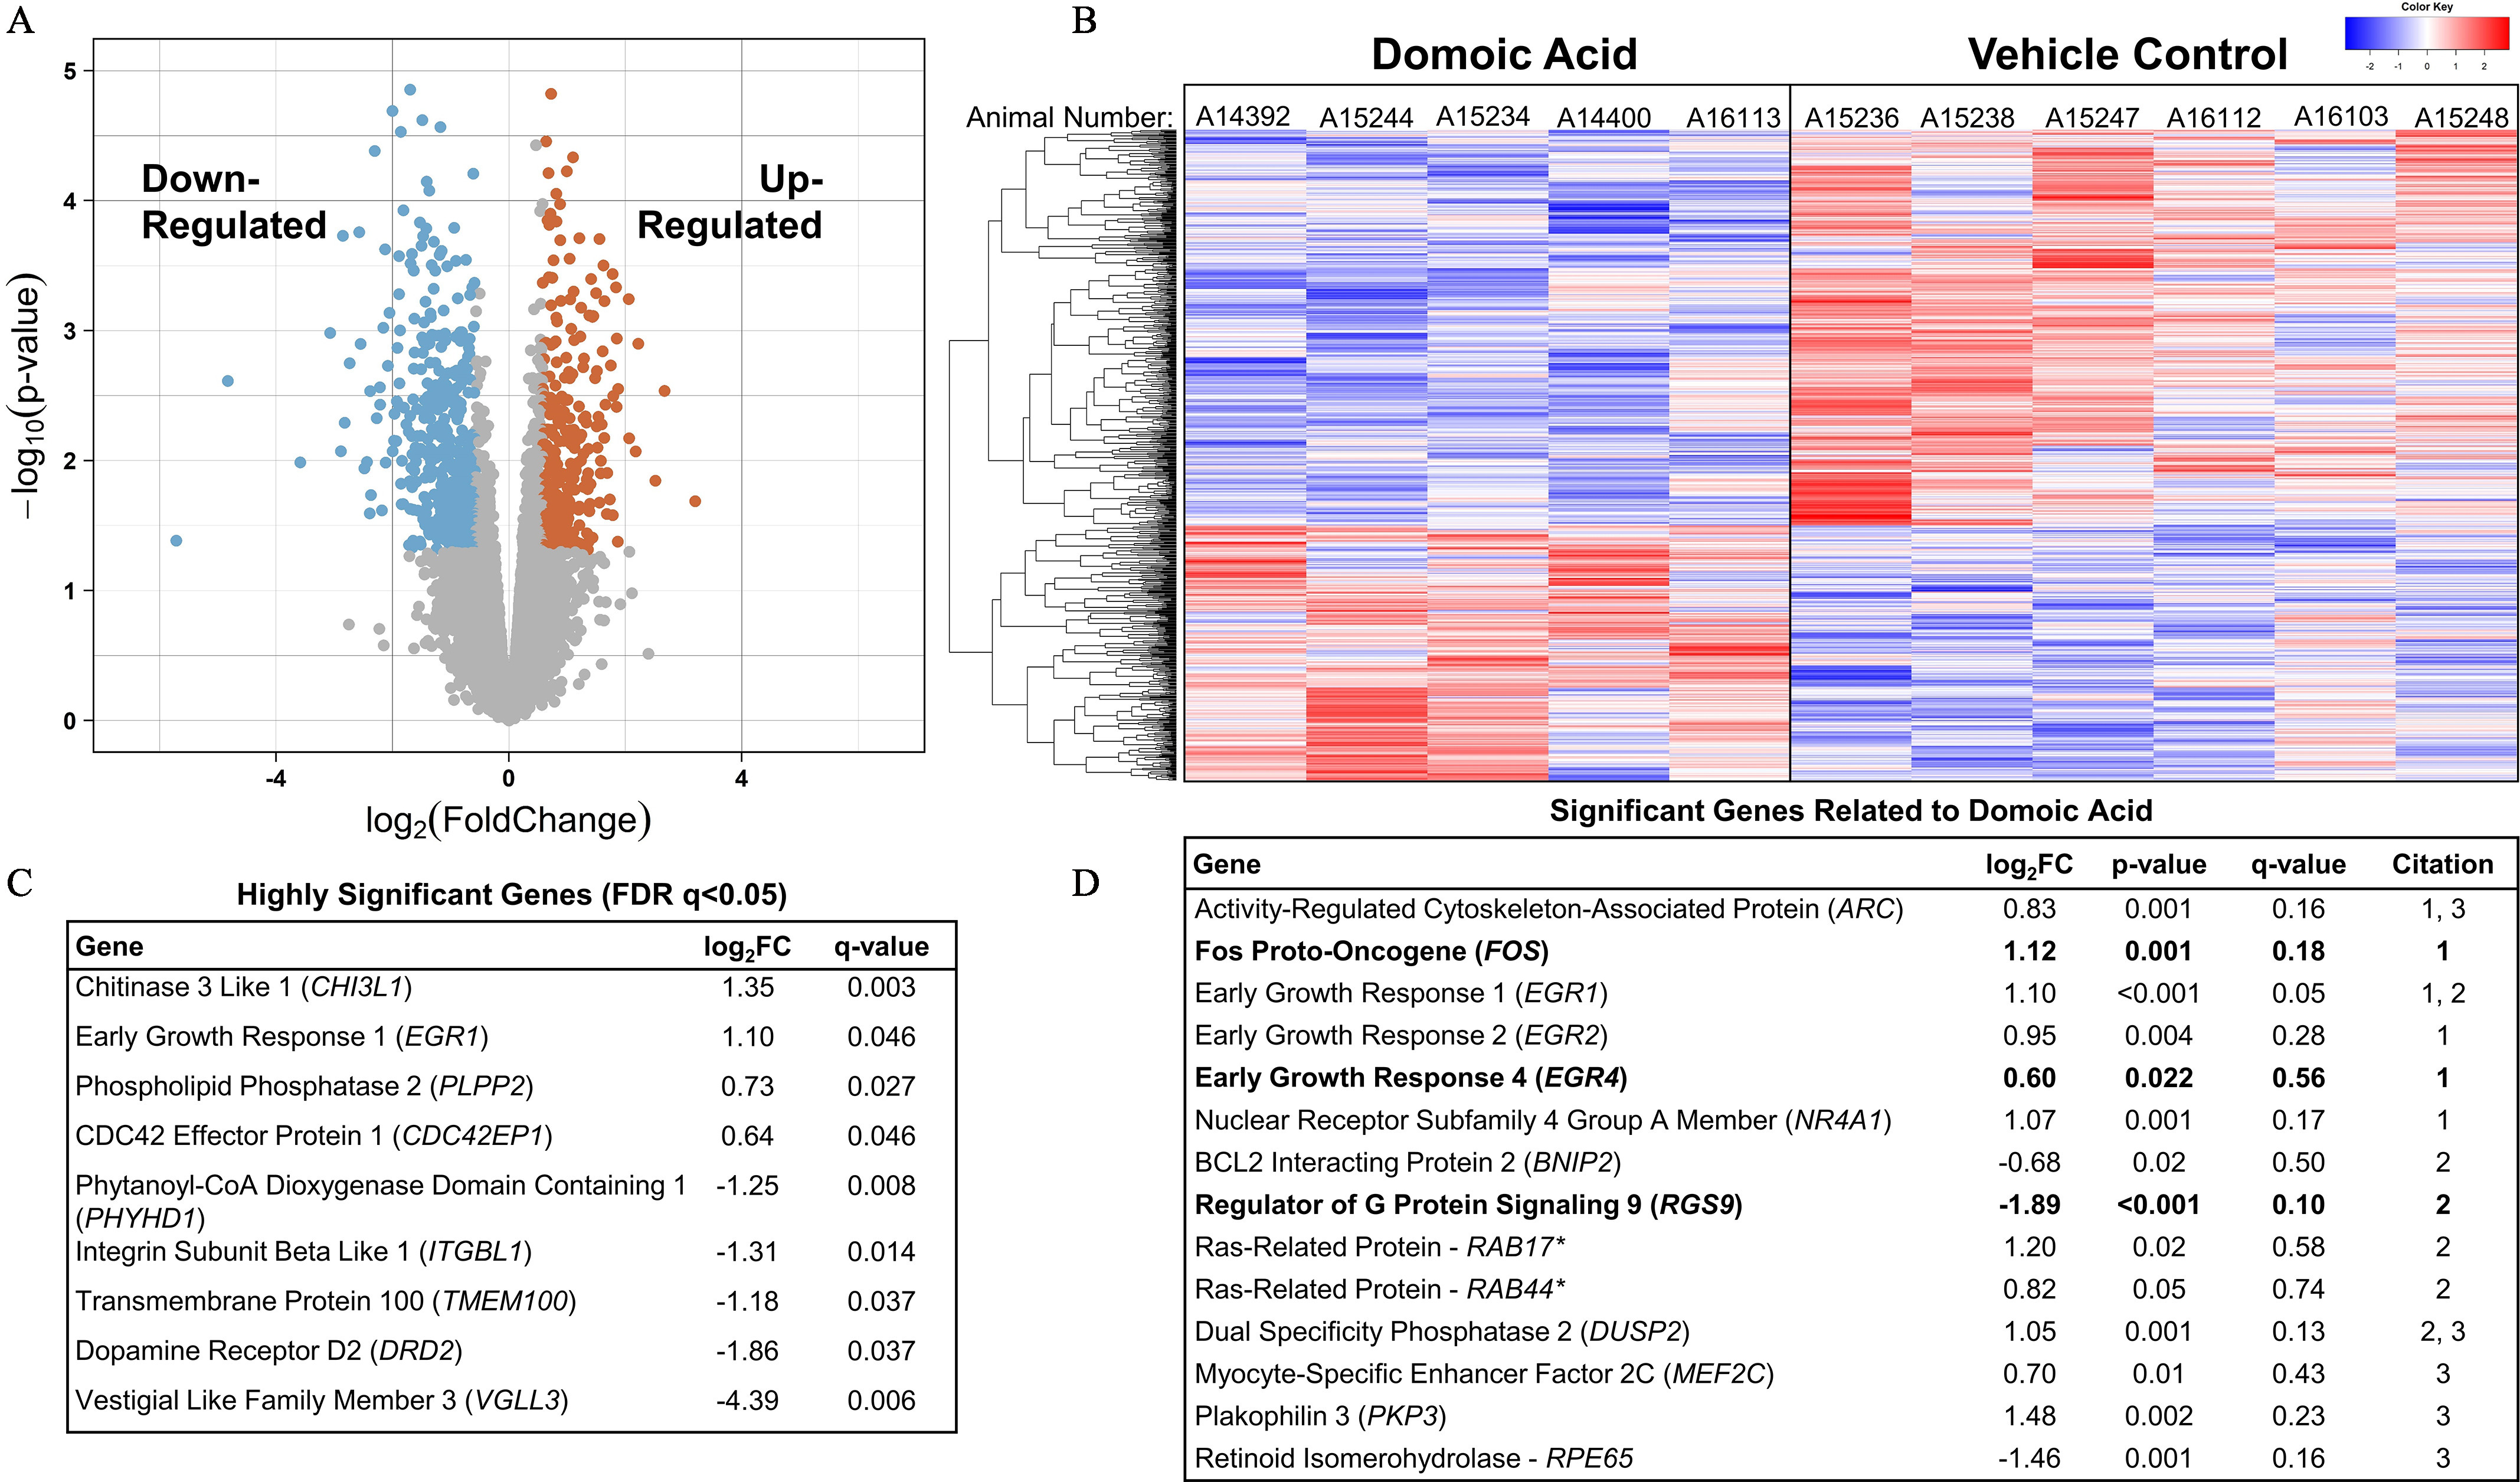
Figure 9A is a volcano plot, plotting negative log to the base 10 of (lowercase p), ranging from 0 to 5 in unit increments (y-axis) across log to the base 2 (fold change), ranging from negative 4 to 4 (x-axis) for Down regulated and Up regulated. Figure 9B is a heatmap, plotting Animal number (y-axis) across domoic acid, including A 14392, A 15244, A 15234, A 14400, and A 16113 and Vehicle control, including A 15236, A 15238, A 15247, A 16103, and A 15248 (x-axis). A scale depicts color key ranges from negative 2 to 2 in unit increments. Figure 9C is a tabular representation titled Highly significant genes (false discovery rate lowercase q less than 0.05) and has nine rows and three columns, namely, Gene, log to the base 2 fold change, and lowercase q value. Row 1: Chitinase 3 like 1, 1.35, and 0.003. Row 2: Early growth response, 1.10, and 0.046. Row 3: Phospholipid Phosphatase 2, 0.73, and 0.027. Row 4: C D C 42 Effector Protein 1, 0.64, and 0.046. Row 5: Phytanoyl-C o A Dioxygenase Domain Containing 1, negative 1.25, and 0.008. Row 6: Integrin subunit beta like 1, negative 1.31, and 0.014. Row 7: Transmembrane Protein 100, negative 1.18, and 0.037. Row 8: Dopamine Receptor D 2, negative 1.86, and 0.037. Row 9: Vestigial like family member 3, negative 4.39, and 0.006. Figure 9D is a tabular representation titled Significant genes related to domoic acid and has fourteen rows and five columns, namely, Gene, log to the base 2 fold change, lowercase p value, lowercase q value, and citation. Row 1: Activity-regulated cytoskeleton-associated protein, 0.83, 0.001, 0.16, and 1,3. Row 2: Fos proto-oncogene, 1.12, 0.001, 0.18, and 1. Row 3: Early growth response 1, 1.10, less than 0.001, 0.05, 1,2. Row 4: Early growth response 2, 0.95, 0.004, 0.28, and 1. Row 5: Early growth response 4, 0.60, 0.022, 0.56, and 1. Row 6: Nuclear receptor subfamily 4 group a member, 1.07, 0.001, 0.17, and 1. Row 7: B C L 2 interacting protein 2, negative 0.68, 0.02, 0.50, and 2. Row 8: Regulator of G protein signaling 9, negative 1.89, less than 0.001, 0.10, and 2. Row 9: Ras-related protein – R A B 17 asterisk, 1.20, 0.02, 0.5, and 2. Row 10: Ras-related protein – R A B 44 asterisk, 0.82, 0.05, 0.74, and 2. Row 11: Dual specificity phosphatase 2, 1.05, 0.001, 0.13, and 2,3. Row 12: Myocyte-specific enhancer factor 2 C, 0.70, 0.01, 0.43, and 3. Row 13: Plakophilin 3, 1.48, 0.002, 0.23, and 3. Row 14: Retinoid isomerohydrolase – R P E 65, negative 1.46, 0.0.1, 0.16, and 3.

RNAseq transcriptional profiling of the hippocampus from female Macaca fascicularis following prolonged exposed to domoic acid (DA) or vehicle (5% sucrose). (A) Volcano plot shows differential expression between DA-exposed and unexposed groups. Each dot represents one gene. As indicated by the text, significantly down-regulated genes are highlighted on the left side and up-regulated gene are highlighted on the right side (log2-FC >1.5 and p0.05). Genes along the middle indicate that expression was not significantly changed. (B) Heatmap shows significantly differentially expressed genes in both the exposed animals (left) and control animals (right). Each column represents an individual animal. A14392, A15244, and A15234 were in the 0.15-mg/kg BW per day group, and A14400 and A16113 were in the 0.075-mg/kg BW per day group. Blue highlighting indicates lower expression level and is observed in the upper two-thirds of the distribution for DA-exposed animals as compared with the lower one-third of the vehicle control animals. The red indicates high expression level and is an inverse distribution to those genes showing lower expression levels. The key in the upper right corner of the image provides the density gradient for the blue (lower) and red (upper). (C) Significant genes with a false discovery rate (FDR) of <0.05. All genes in this table had a p<0.001. (D) Significant genes previously reported to be differentially expressed in either a) mice,74 b) acute zebrafish,75 or c) chronic zebrafish76 after DA exposures. Bolded values indicate genes that were differentially expressed in the same direction across the previous studies. *Denotes unspecified homologous RAB gene identified in zebrafish. Note: FC, fold change; RNAseq, RNA sequencing.