
Fig. 1.
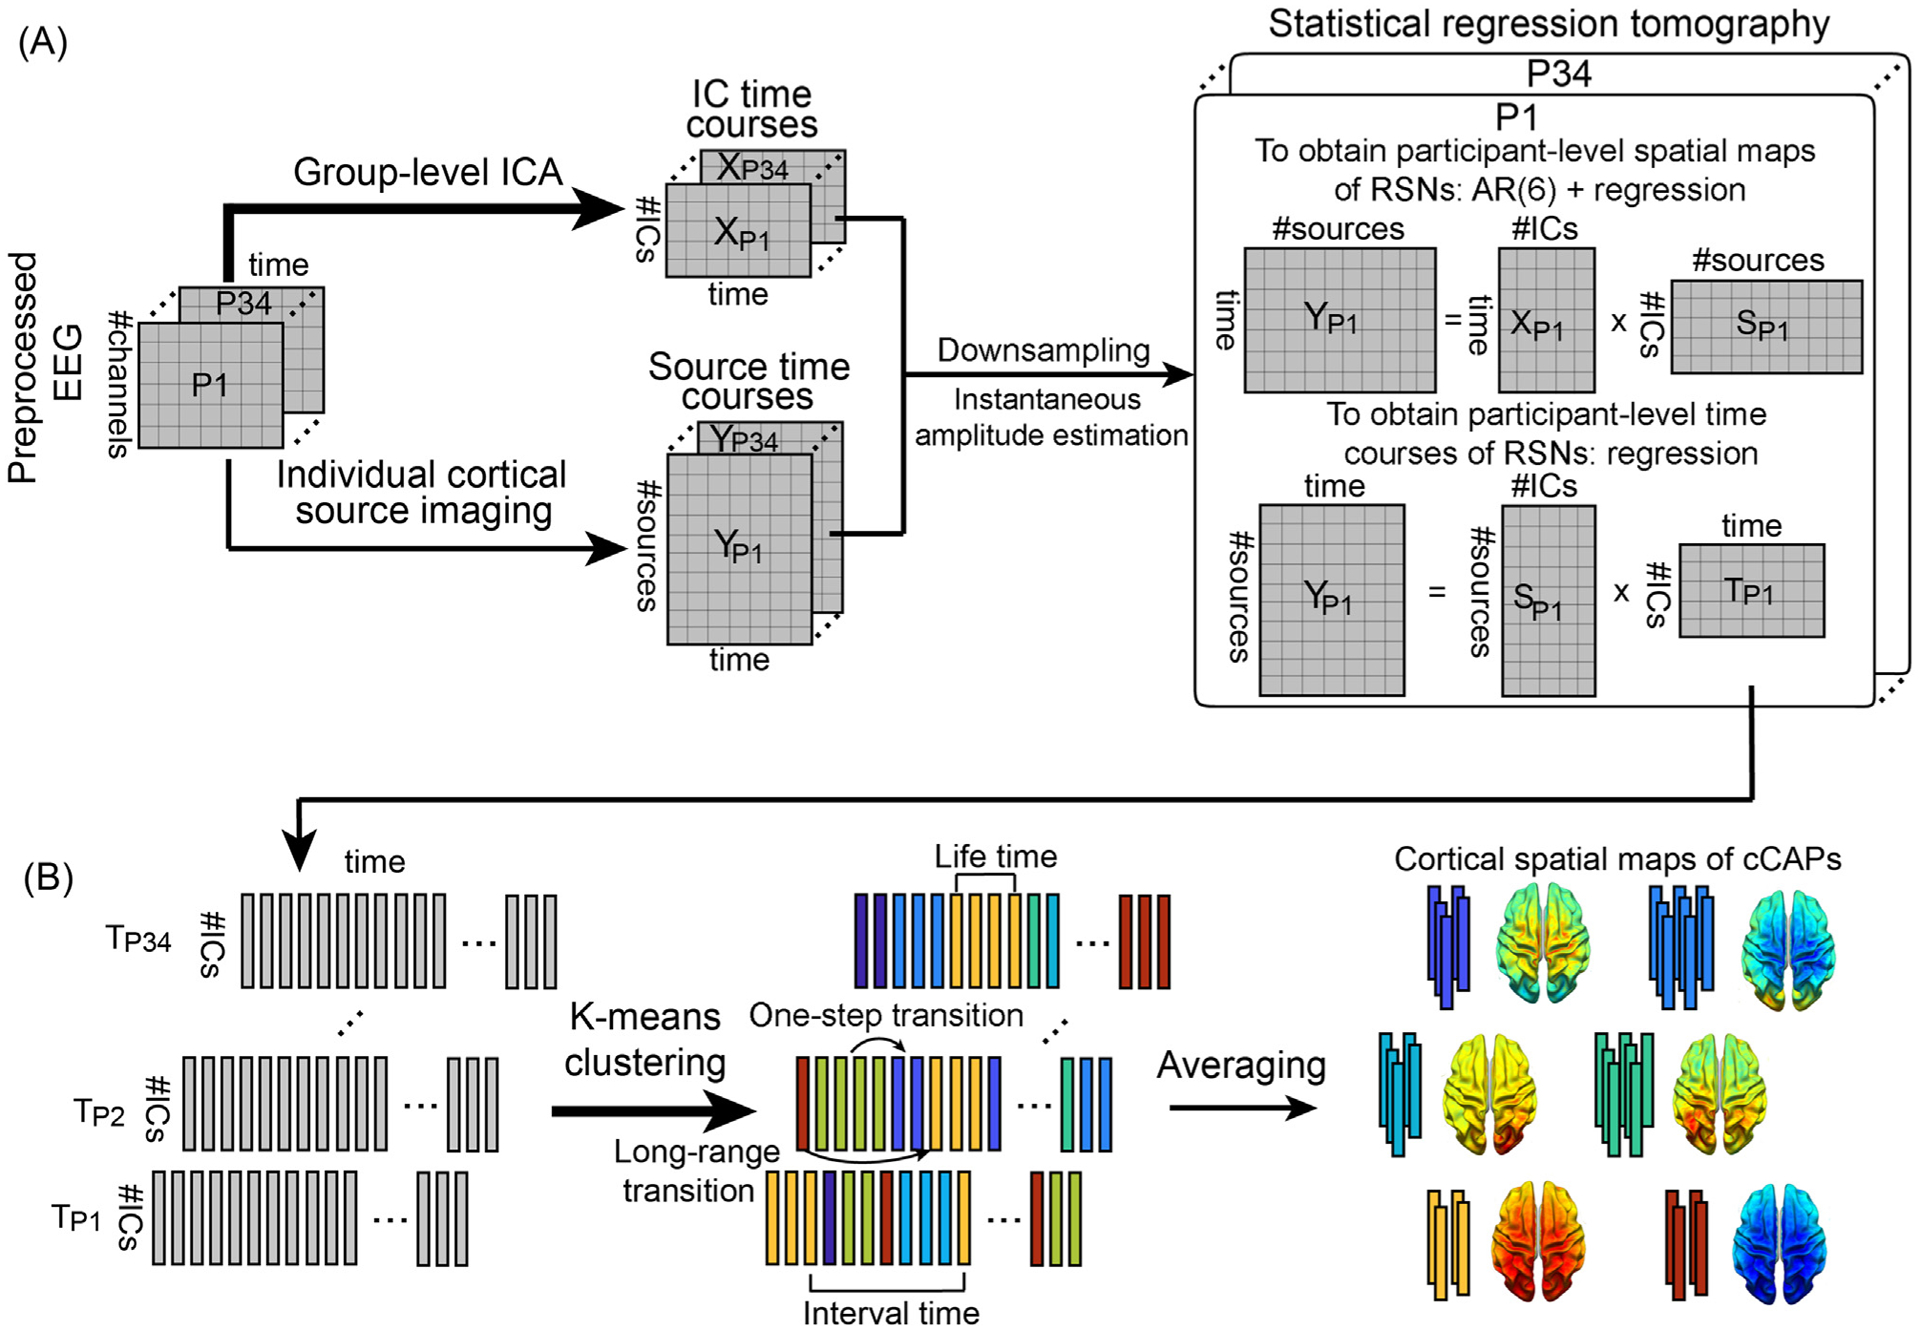
Schematic illustration of the method. (A) Spatial definitions of cortical RSNs and their dynamics calculated using a statistical dual-regression analysis between the instantaneous amplitudes of sensor-level IC time courses and cortical-level source time courses. IC time courses are calculated from a group-level ICA on preprocessed EEG data temporally concatenated across all participants. Cortical source time courses are calculated by cortical source imaging from EEG and MRI data of individual participants. (B) Recurring brain states and their dynamic transitions captured and classified by clustering timeframe data of cortical RSNs into short-lived spatially congruent patterns (i.e., cCAPs) using the k-means algorithm. Four temporal and transitional measures, i.e., lifetime, interval time, one-step transition, and long-range transition, are illustrated. P: participant; T: timecourse.