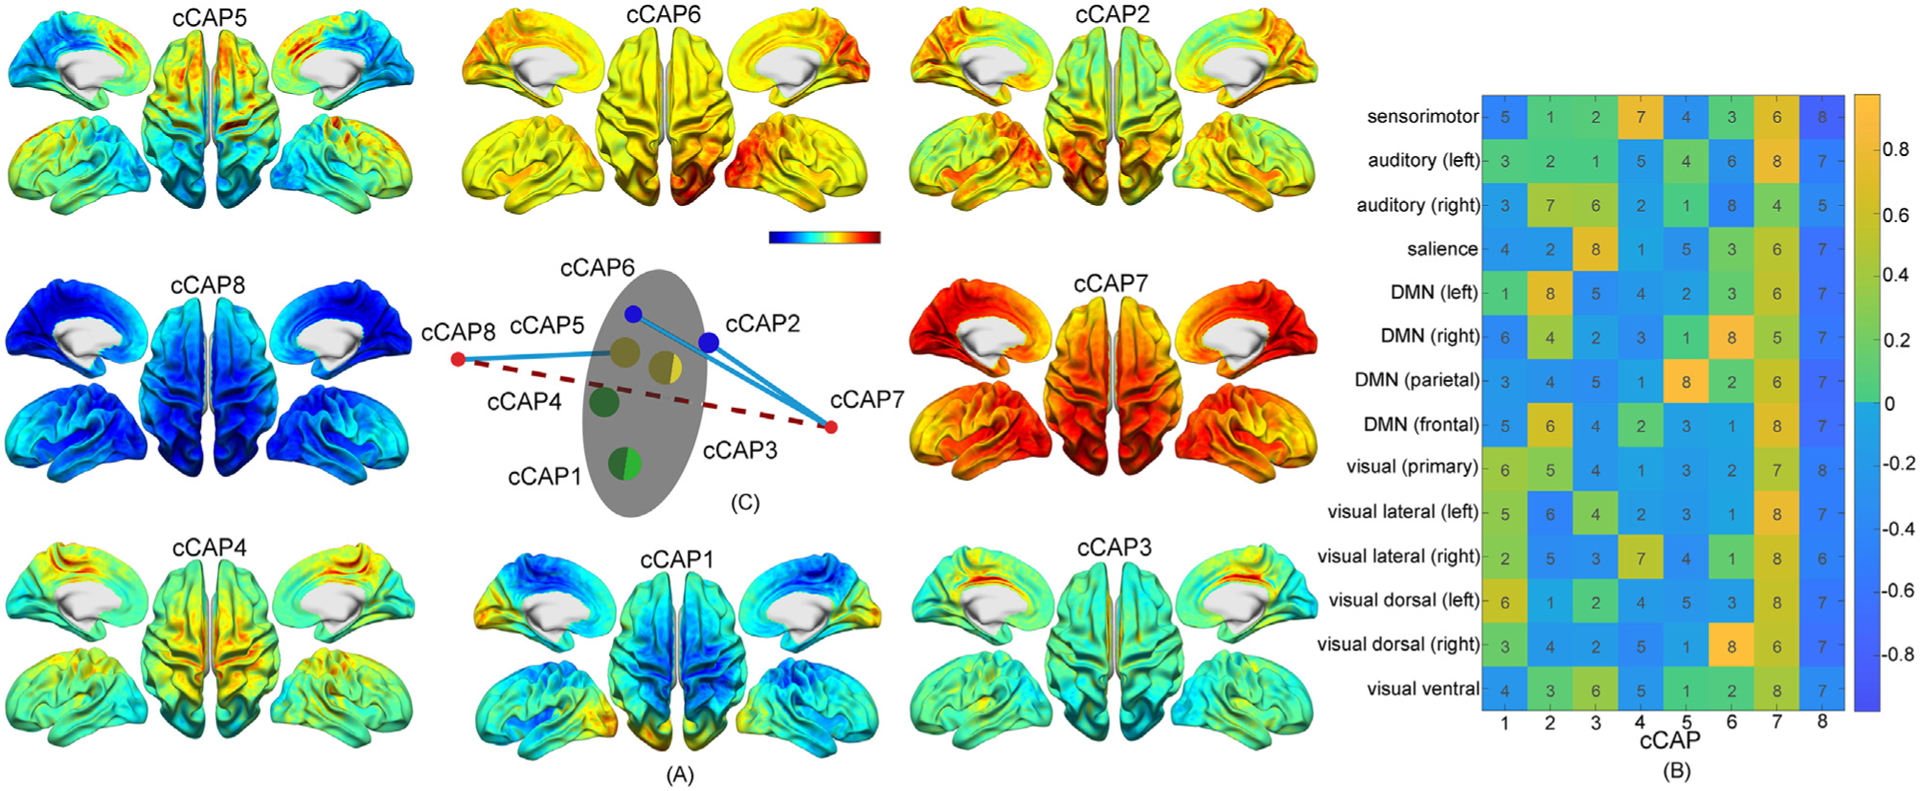
Fig. 2.

A set of spatially-structured functional states with brain-wide patterns, i.e., cCAPs, from the resting human brain. (A) Cortical maps of the cCAPs identified at the group level in which both cCAPs 7 and 8 show global co-(de)activation patterns. Red-yellow colors indicate co-activations (i.e., high neuronal currents), and blue indicates co-deactivations (i.e., low neuronal currents). (B) The weight vectors, i.e., columns, of the cluster centers of all cCAPs. Colors indicate weight amplitudes (with±signs) of individual RSNs at the cluster centers of cCAPs and numbers indicates the amplitude ranks (no signs) of same individual RSNs across all cCAPs. DMN: Default mode network. (C) The distance map of the weight vectors of all cCAPs projected into a 3D space. Same-color dots: anti-state pairs and hemisphere-symmetric pair; red dots: two polarized states, i.e., cCAPs 7 and 8, connected by the dashed line; blue lines: connecting brain states that are structurally closest to two polarized states (see more in Supplementary Fig. 3A); gray circular plane: halfway between two polarized states.
