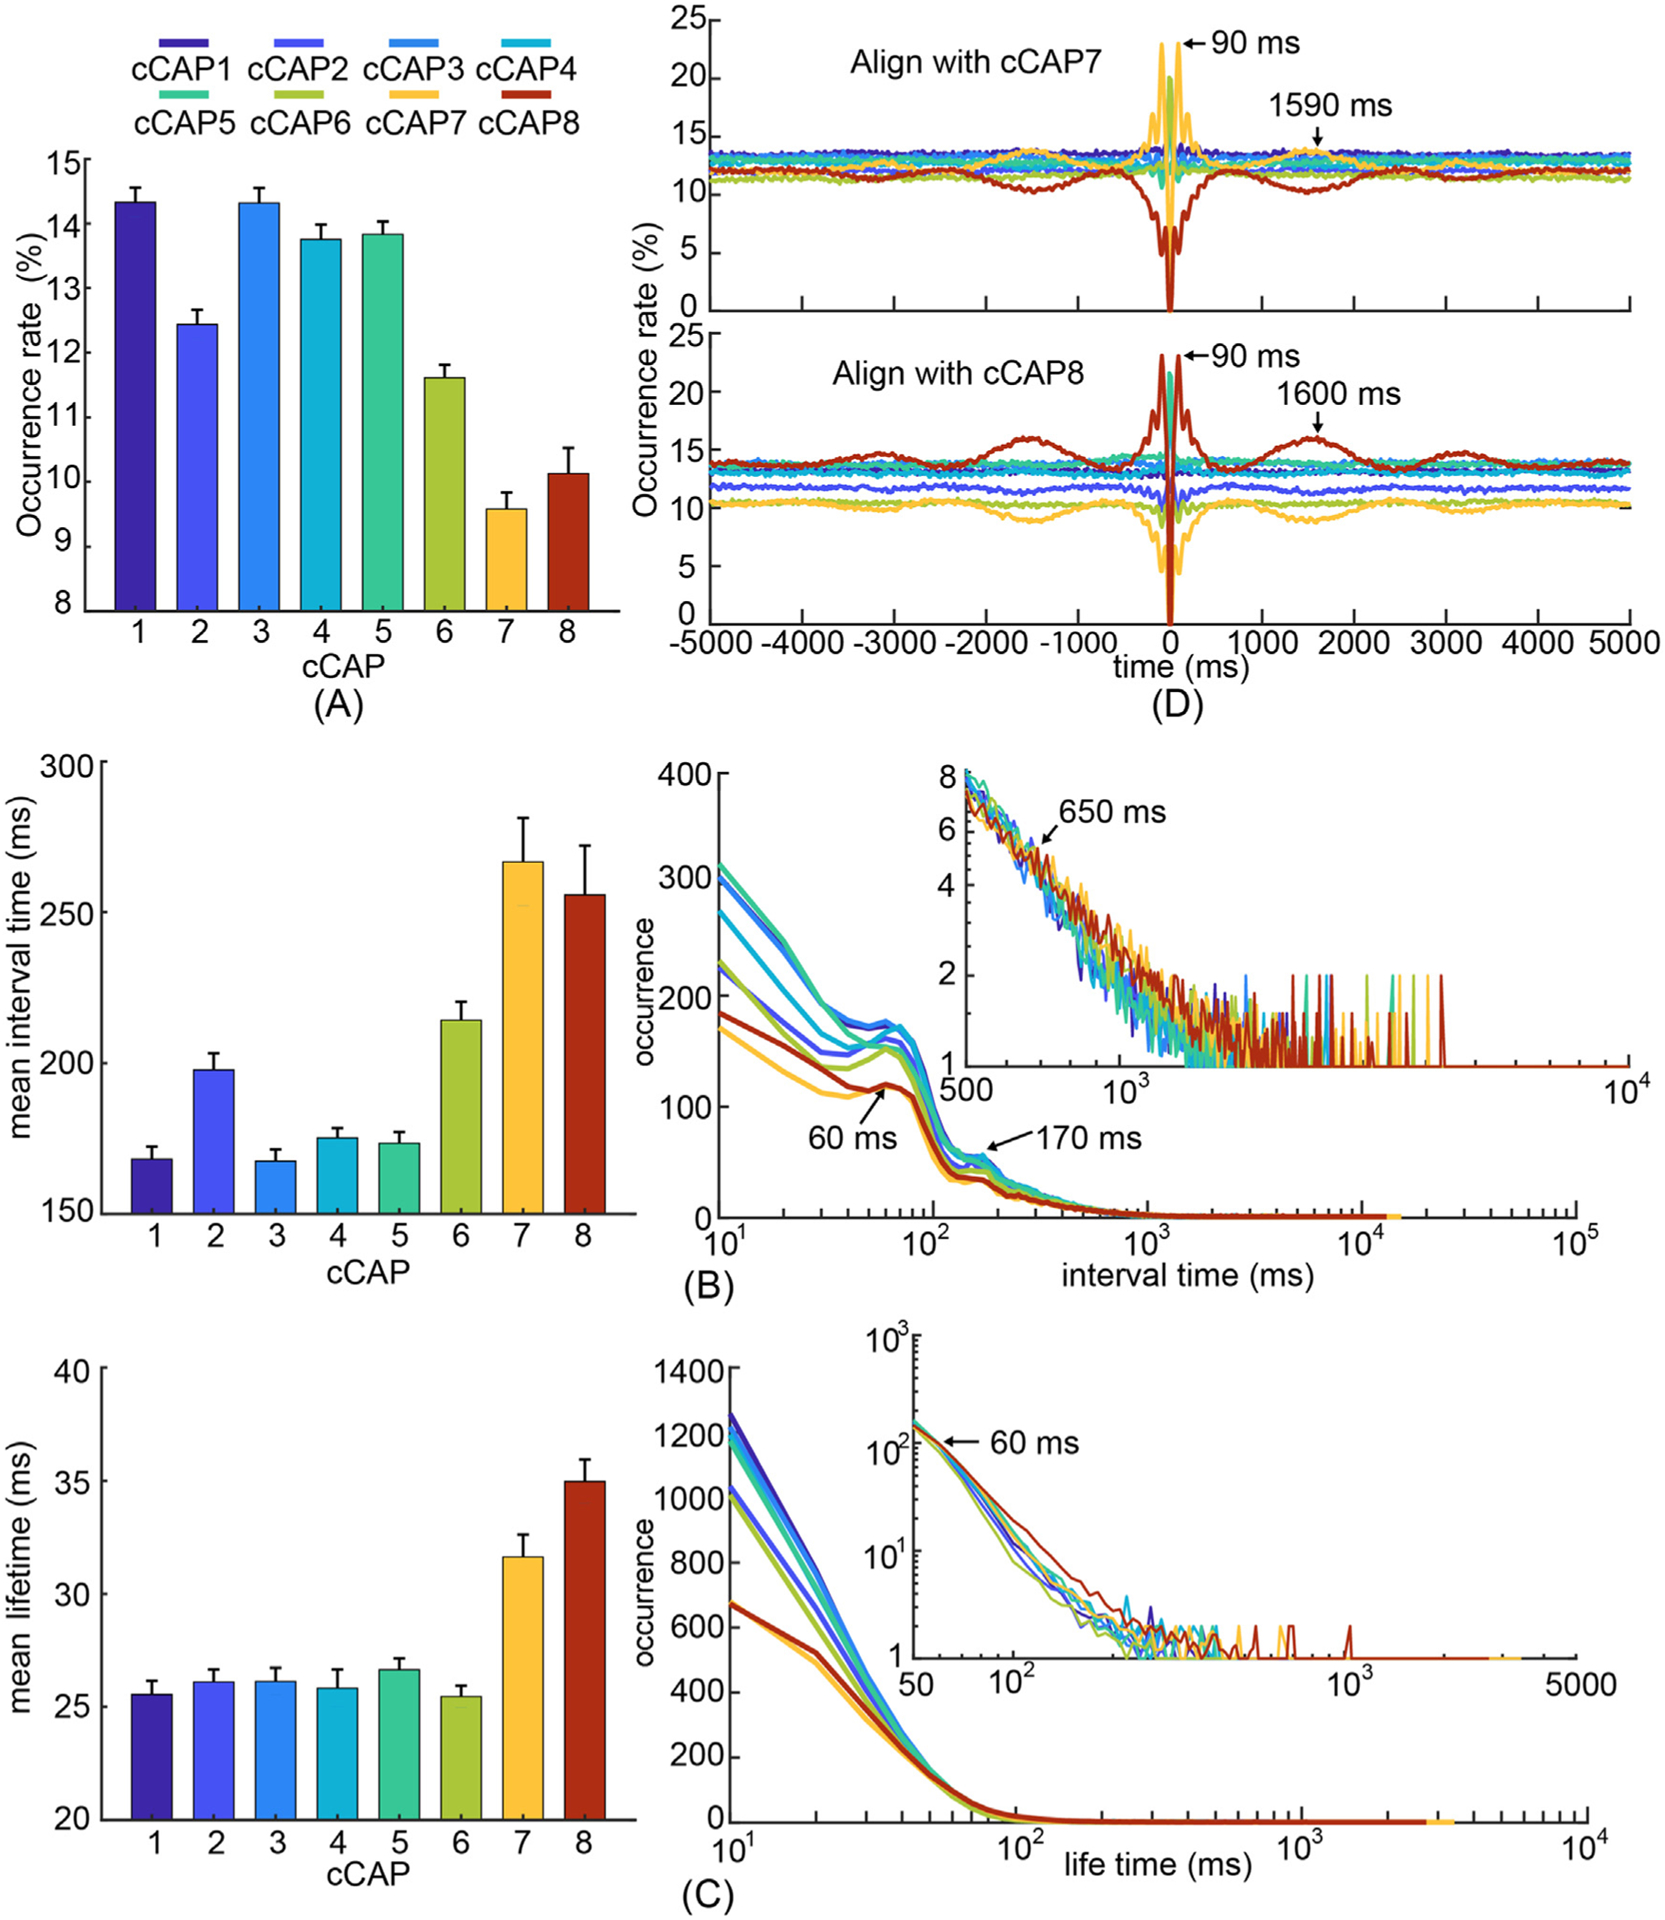
Fig. 3.

Temporal characteristics of recurring functional brain states, i.e., cCAPs. (A) Occurrence rates of cCAPs (mean±SEM) where cCAPs 7 and 8 show significantly lower occurrences than others (p < 0.05, FDR corrected). (B) Mean (±SEM) values (left) and histograms (right) of interval times of cCAPs. Note that cCAPs 7 and 8 have significantly longer mean interval time than others (p < 0.05, FDR corrected). All histograms show two peaks (around 60 ms and 170 ms) and the occurrences of cCAPs 7 and 8 become higher than other cCAPs beyond the interval time of 650 ms (the inset). (C) Mean (±SEM) values (left) and histograms (right) of lifetimes of cCAPs. Note that cCAPs 7 and 8 have significantly longer mean lifetime than others (p < 0.05, FDR corrected). The occurrences of cCAPs 7 and 8 become higher than other cCAPs beyond the lifetime of 60 ms (the inset). (D) Occurrence probabilities of all cCAPs as functions of time distances toward all occurrences of the target cCAP 7 (top) and cCAP 8 (bottom). See other cCAPs as the target cCAP in Supplementary Figs. 5B–C. SEM: standard error of mean.
