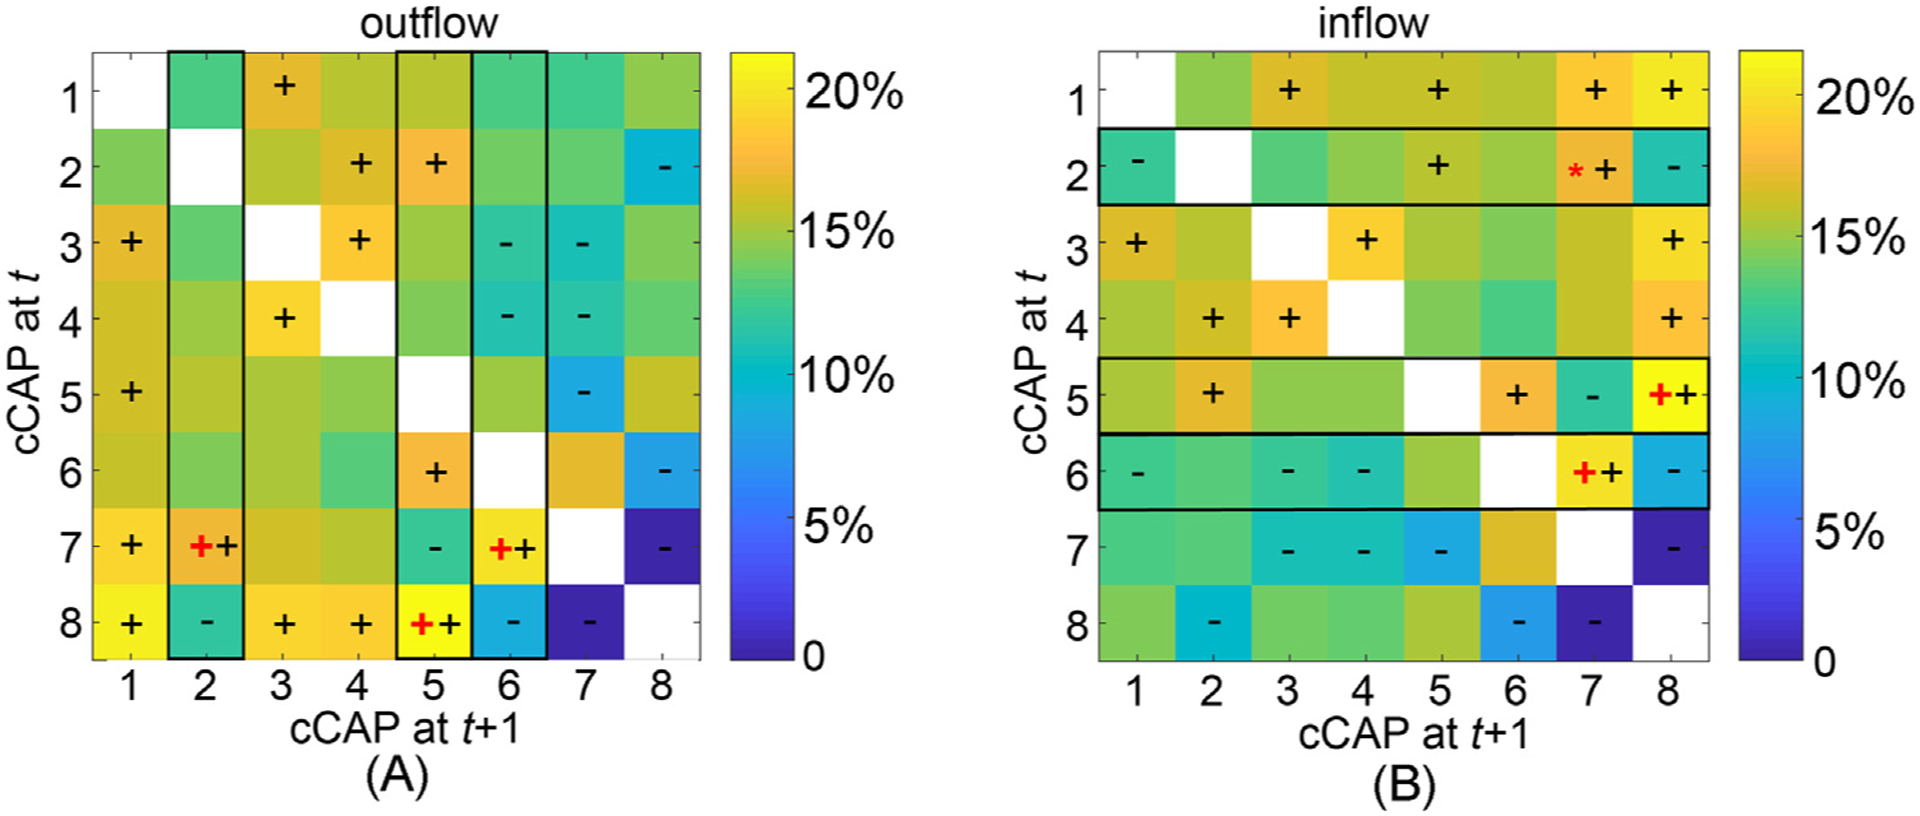
Fig. 4.

The immediate transition probability (one-step from time t to time t + 1) among functional brain states: (A) the outflow matrix (normalized in rows) and (B) the inflow matrix (normalized in columns). The signs ‘+’ and ‘−’denote significantly higher or lower transition probability values, respectively, than the equal probability value (i.e., 1/7, p < 0.05, Bonferroni adjusted). The black rectangles highlight the columns (in A) and rows (in B), in which the cCAPs with the largest outflow or inflow values that are significantly higher than the second largest values are labeled (‘+’: p < 0.001, Bonferroni adjusted, ‘*’: p < 0.05, unadjusted). These identified cCAPs (labeled as ‘+’ or ‘*’) appear only to be the ones that are spatially close to two polarized states (Fig. 2C).
