
Fig. 5.
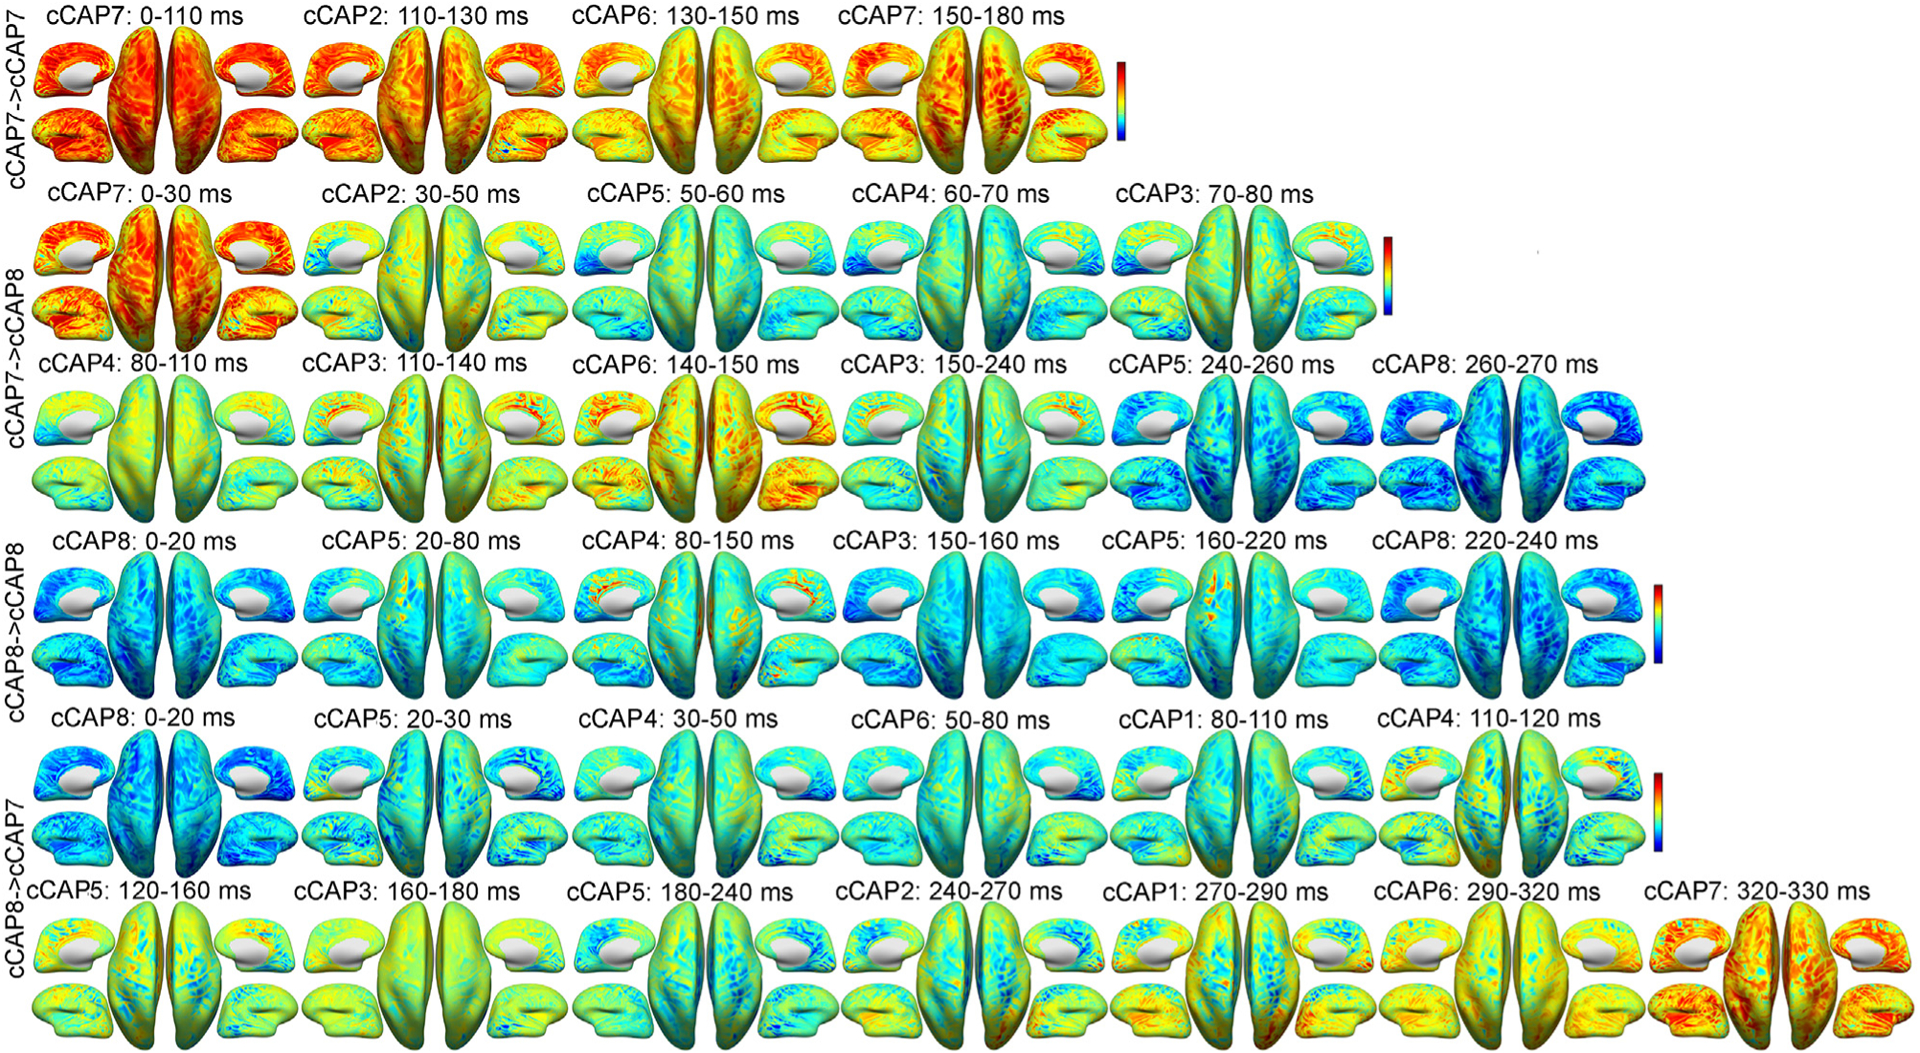
Representative occurrences for two long-range transitions and two reference transitions between two polarized functional brain states (Fig. 2) on the inflated cortical surface from a participant: cCAP 7→7, cCAP 7→8, cCAP 8→8 and cCAP 8→7. Each map represents the averaged cortical pattern of an occurred cCAP over all timeframes within its lifetime window (labeled above) during the sequenced transition. See Supplementary Movies 1–4 for corresponding videos in continuous timeframes.