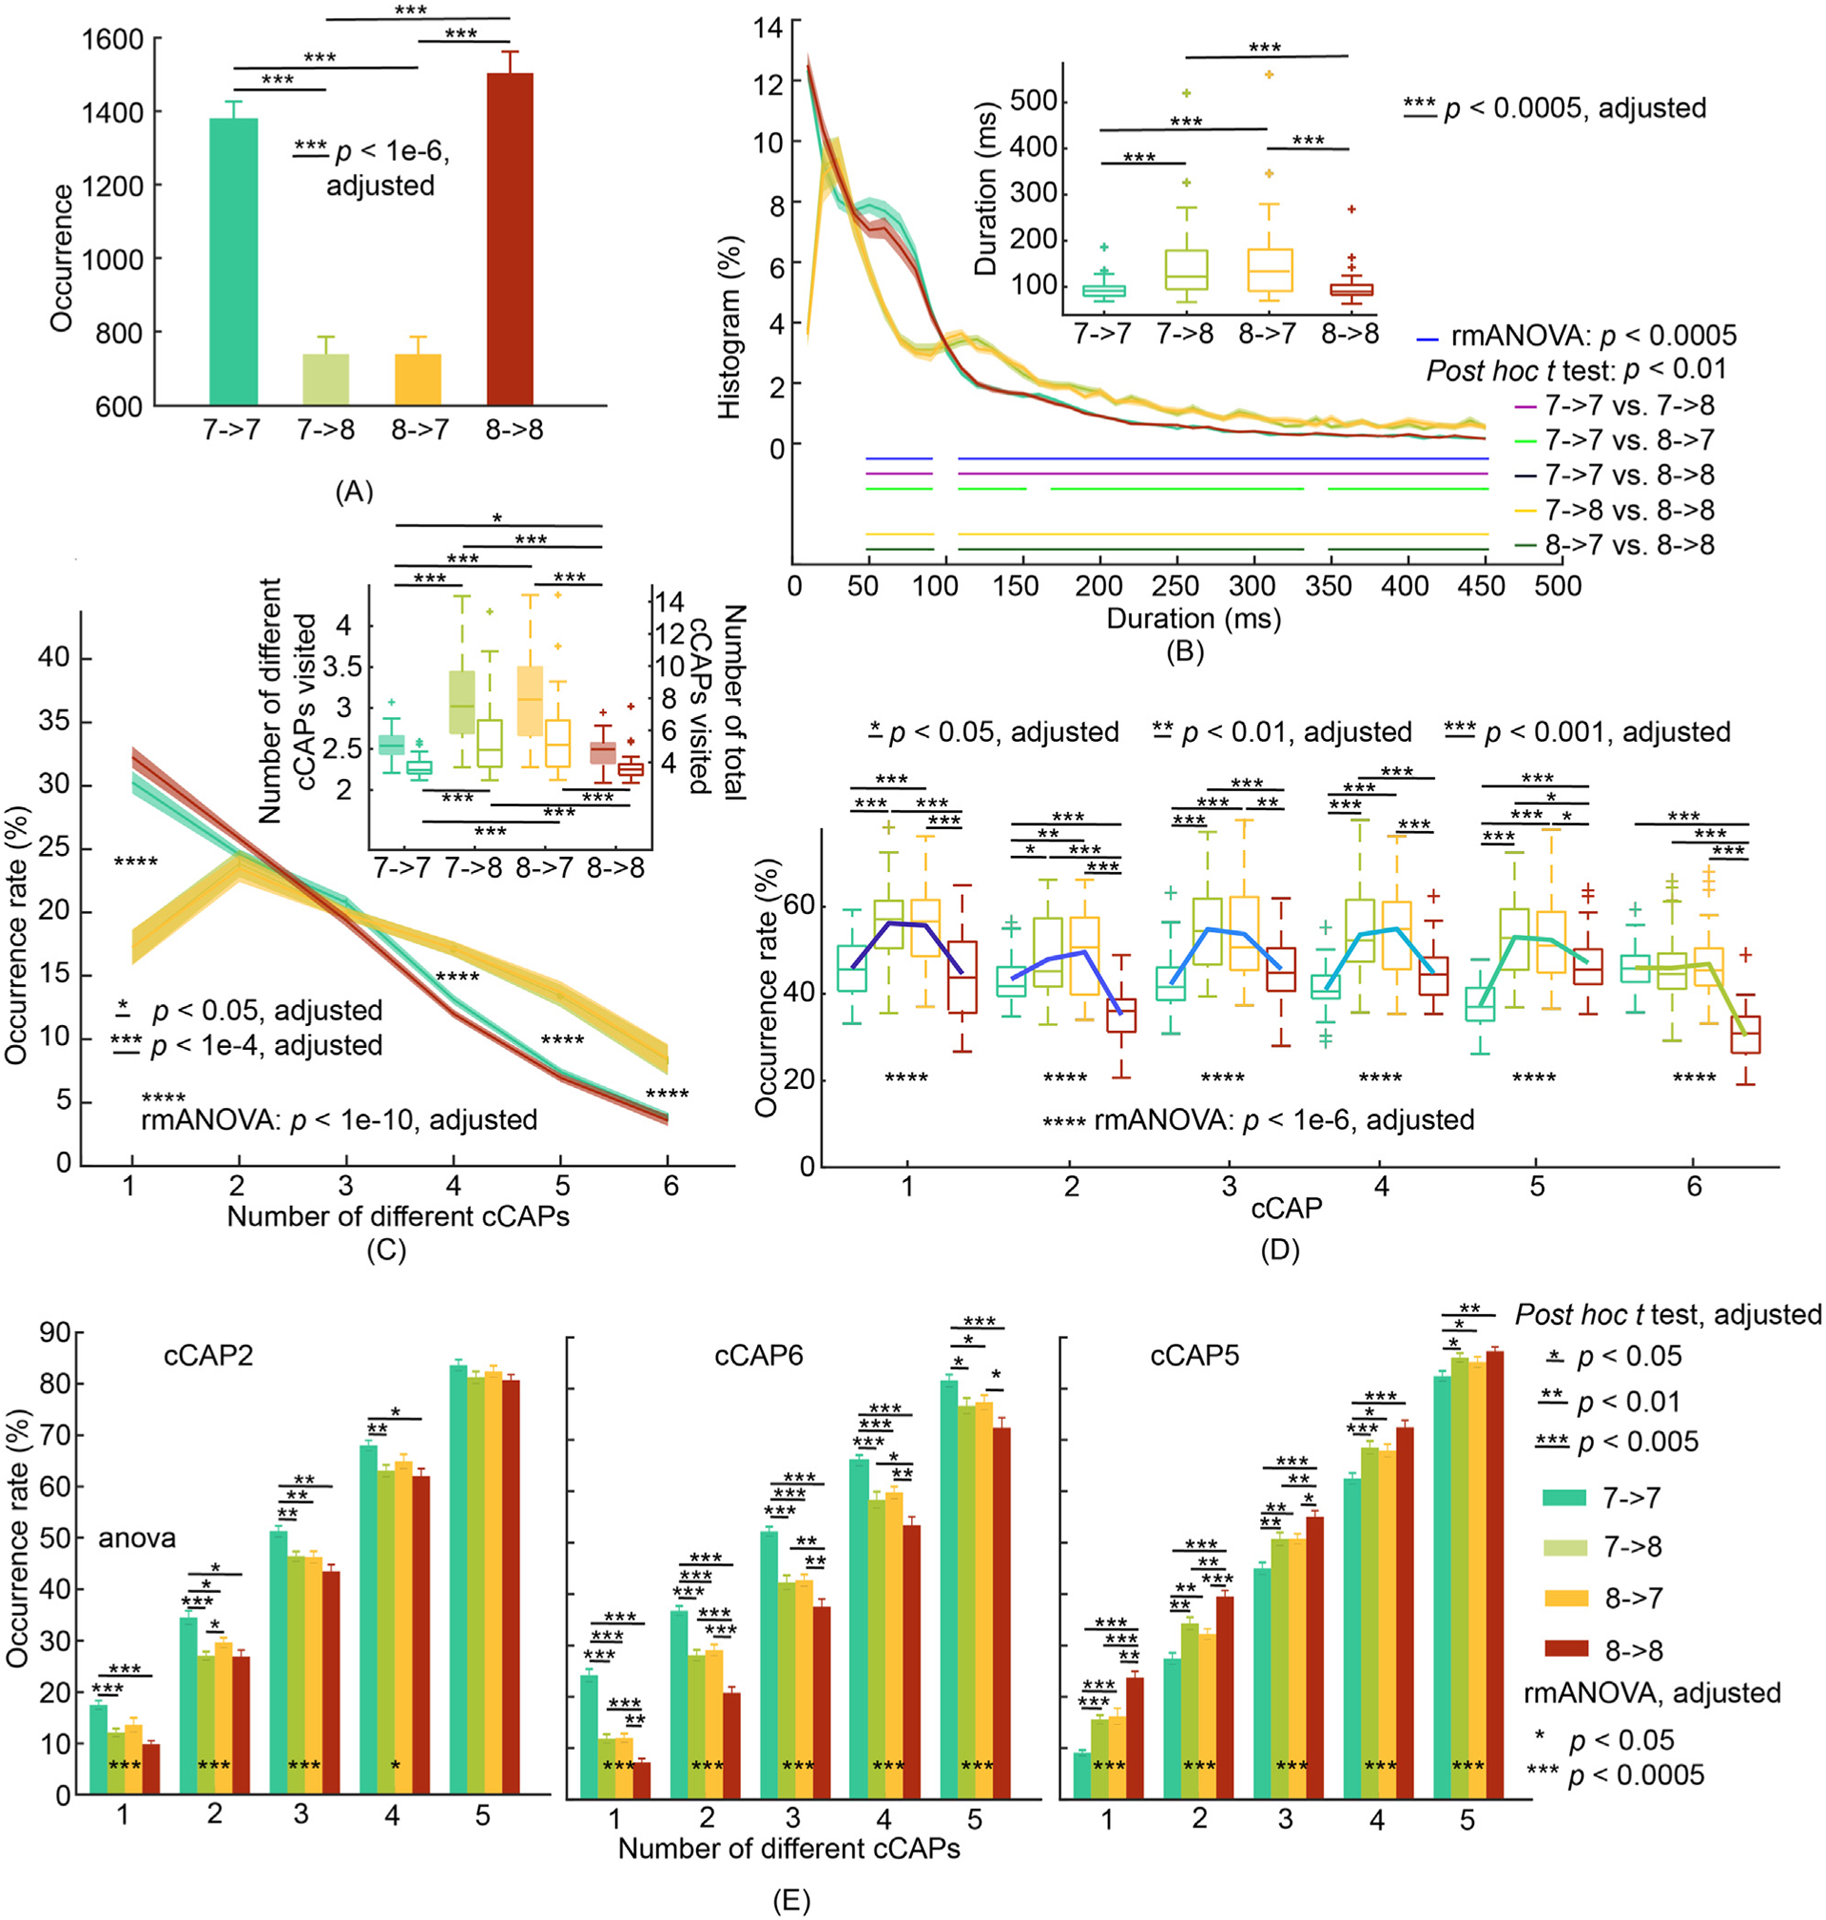
Fig. 6.

Patterns of transitions between two polarized functional brain states of cCAPs 7 and 8. (A) Occurrences of two long-range transitions: cCAP 7→8 and cCAP 8→7, and two reference transitions: cCAP 7→7 and cCAP 8→8. (B) Boxplots (inset) of mean durations and histograms of durations (SEM: shaded areas) as functions of time for four types of transitions. (C) Occurrence rates of four types of transitions (SEM: shaded areas) as functions of the number of different cCAPs (the six non-polarized cCAPs) visited per occurrence. Inset: Participant-level means (±SEM) of numbers of different cCAPs (left y-axis and boxplots with solid-fills) and total numbers of cCAPs (right y-axis and boxplots with no-fills) visited per occurrence. Post-hoc t tests indicate significant differences (p < 0.01, adjusted) when the number of different cCAPs equals to 1, 4, 5, and 6 between two long-range transitions and two reference transitions. (D) Occurrence rates of the six non-polarized cCAPs within each type of transition. (E) Occurrence rates of cCAPs 2, 6 and 5 within each type of transition as functions of number of different cCAPs visited per occurrence. See Supplementary Fig. 7 for cCAPs 1, 3, and 4. The condition of number of cCAPs as 6 is omitted since all occurrence rates are 100% by the definition of this metric.
