
Fig. 7.
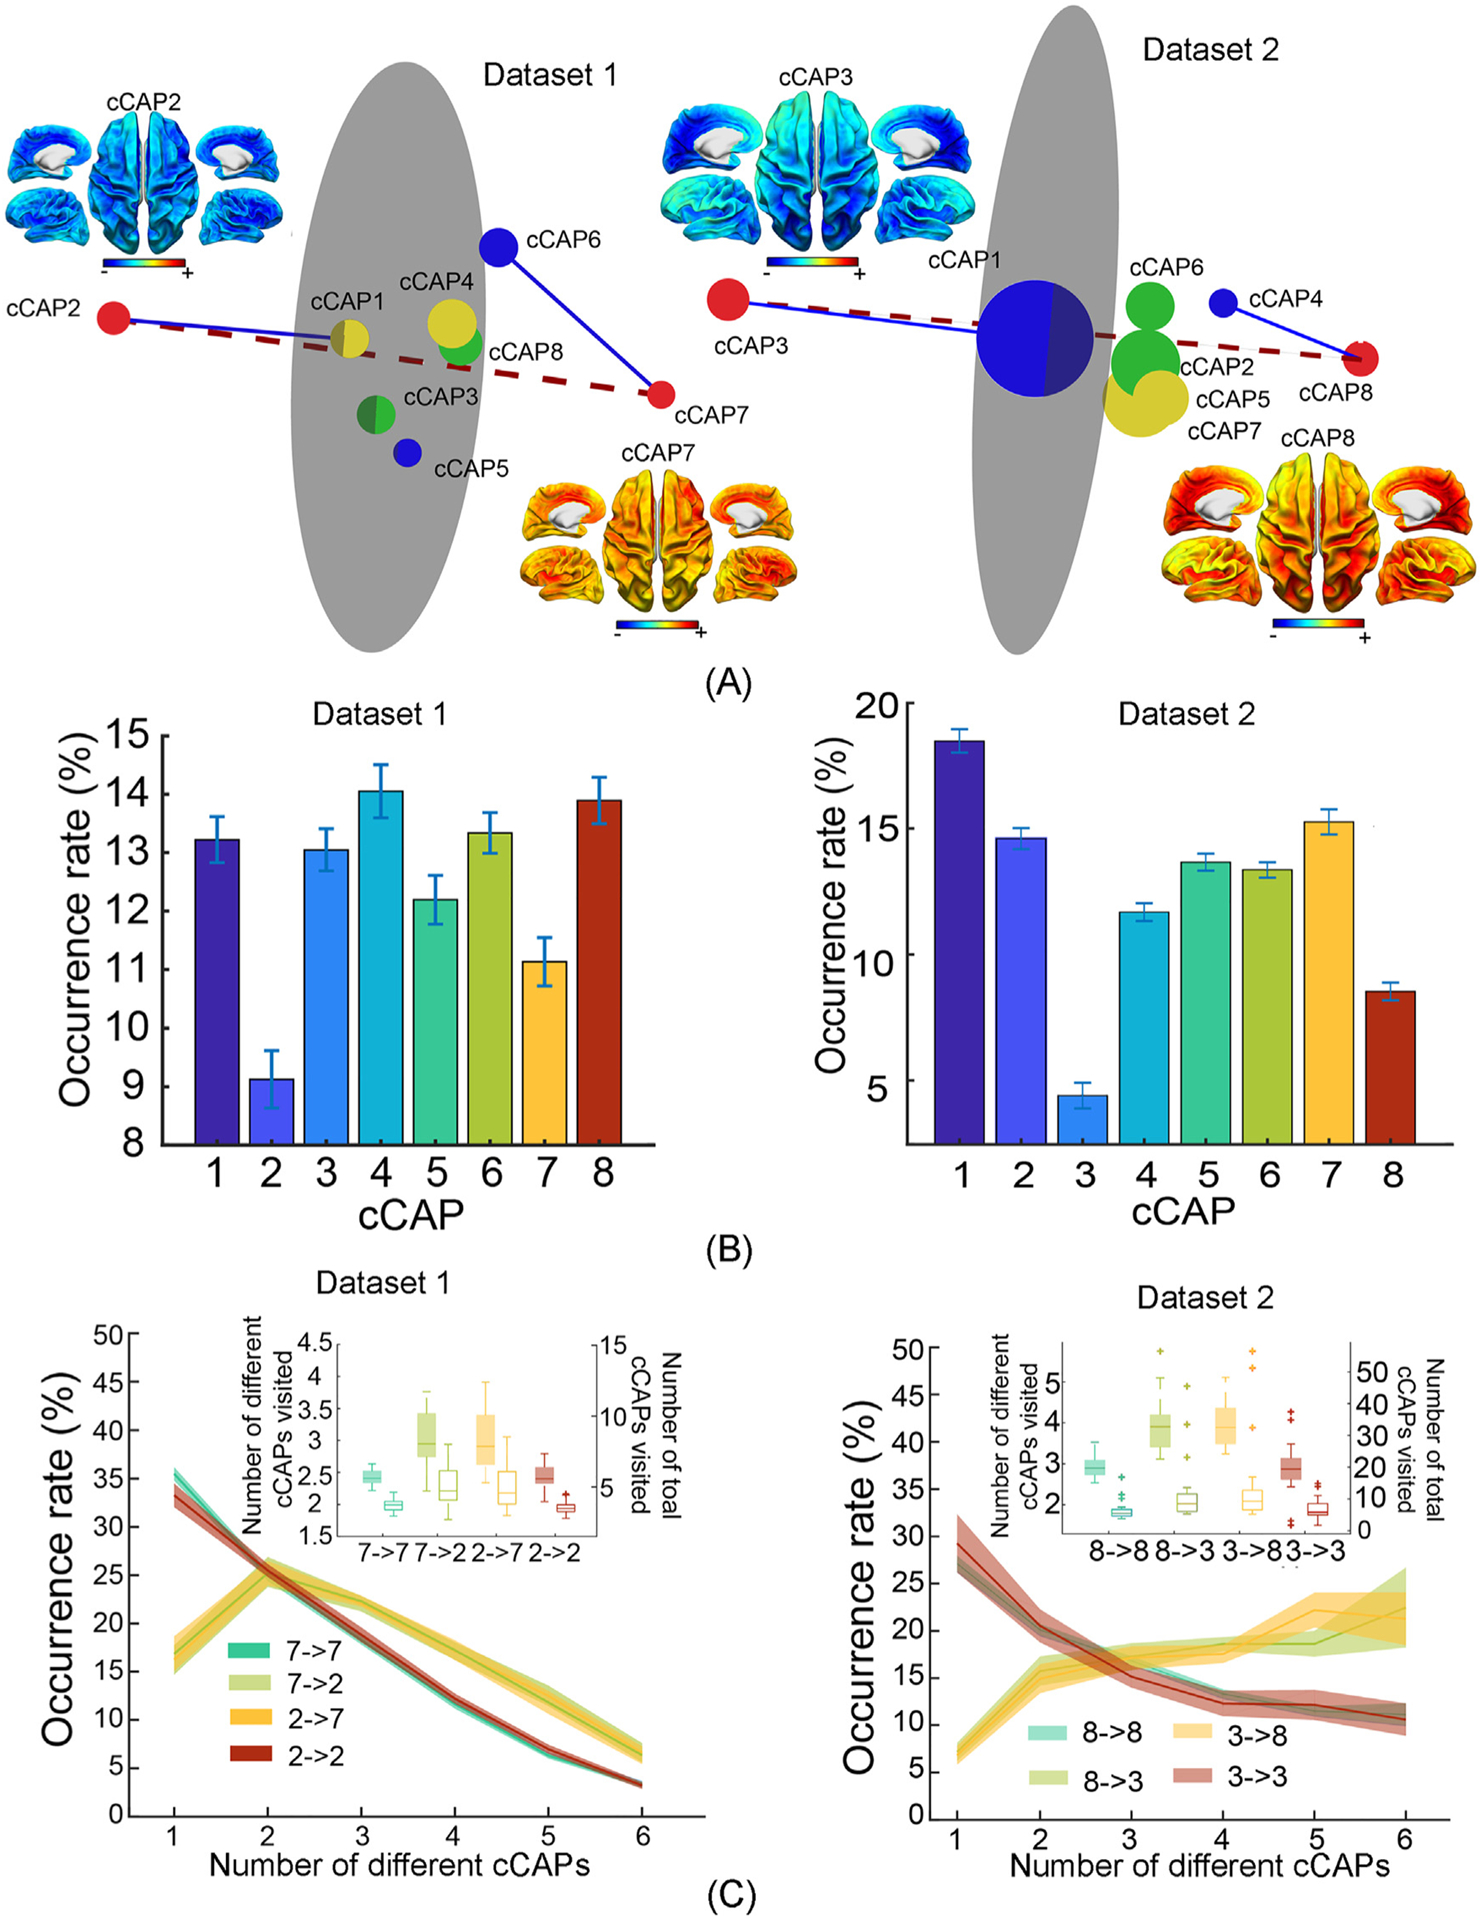
Reproduced key results of brain-wide functional states and their spatial, temporal, dynamic patterns from Datasets 1 and 2. (A) Spatial maps of two polarized global co-(de)activation brain states, i.e., cCAPs 2 and 7 in Dataset 1 and cCAPs 3 and 8 in Dataset 2, and the 3D distance maps among all cCAPs. Same-color dots: anti-state pairs; red dots: two polarized states connected by the dashed line; blue lines: connecting brain states that are structurally closest to two polarized states; gray circular plane: halfway between two polarized states (see Fig. 2). (B) Occurrence rates of cCAPs (see Fig. 3). (C) Occurrence rates of four types of transitions as a function of the number of cCAPs visited per occurrence (see Fig. 6 for more details).