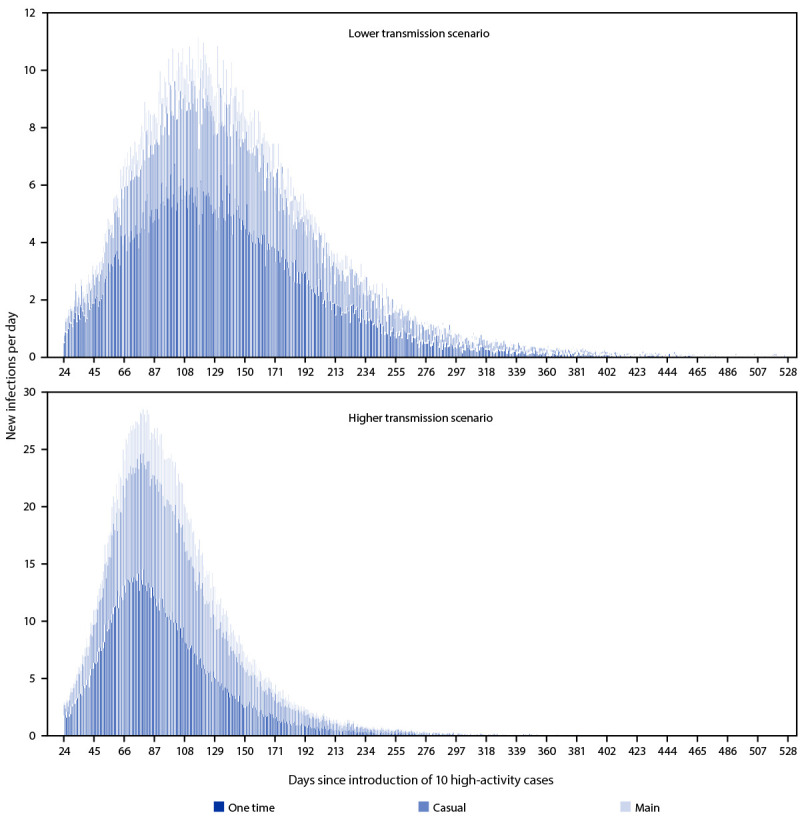
FIGURE 1.

Modeled number* of new infections each day by lower† and higher§ transmission scenarios and type of partnership over the course of a monkeypox outbreak among men who have sex with men, by time since importation of 10 high activity cases — United States, 2022
* Numbers presented are the mean number of infections across 60 stochastic trials in which no premature extinction occurred.
† In the lower transmission scenario, it was assumed that there was a 60% probability of Monkeypox virus transmission per sex act: 54.0% of transmission occurred through one time, 33.2% through casual, and 12.9% through main partnerships over the course of the outbreak.
§ In the higher transmission scenario, it was assumed that there was a 90% probability of Monkeypox virus transmission per sex act: 45.6% of transmission occurred through one time, 38.8% through casual, and 15.6% through main partnerships over the course of the outbreak.
