Figure 1.
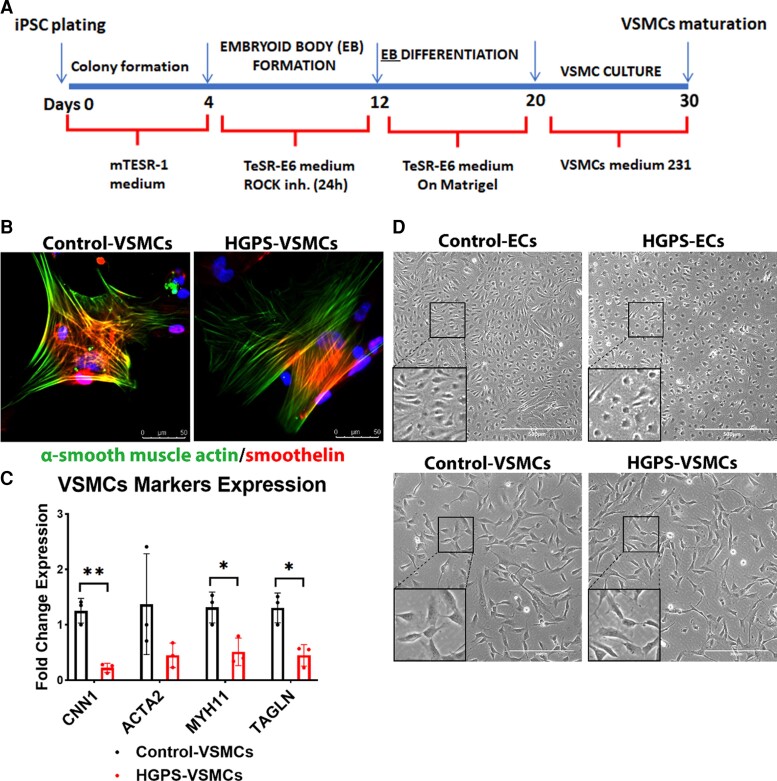
Differentiation and characterization of induced pluripotent stem cells-derived endothelial cells and vascular smooth muscle cells. (A) Schematic of the methodology used to differentiate induced pluripotent stem cells into vascular smooth muscle cells. (B) Immunofluorescence staining of smooth muscle cells specific markers: smoothelin and α-smooth muscle actin from control-VSMCs and HGPS-VSMCs (scale bar: 50 μm). (C) Quantitative reverse transcription polymerase chain reaction for vascular smooth muscle cell marker expression: CNN1, ACTA2, MYH11, and TAGLN after differentiation in control-VSMCs and HGPS-VSMCs. n = 3. (D) Brightfield images of endothelial cells (scale bar: 500 μm) and vascular smooth muscle cells (scale bar: 300 μm) in both control and Hutchinson–Gilford progeria syndrome groups after differentiation. Statistical analysis was performed by an unpaired t-test when comparing two groups. A value of P < 0.05 was considered statistically significant. *P < 0.05; **P < 0.01.

