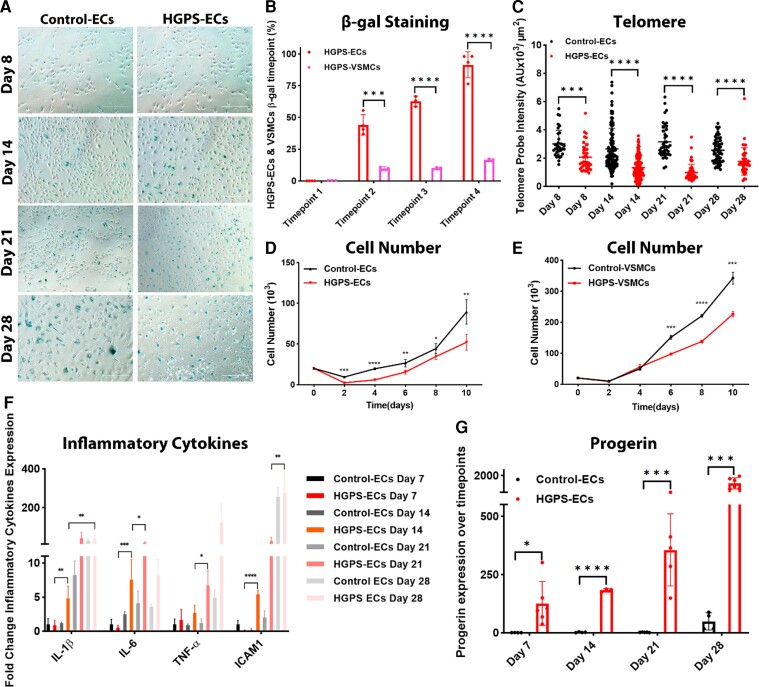
Figure 4.
Aging is more accelerated in HGPS-ECs. (A) β-gal staining for control-ECs and HGPS-ECs on Days 8, 14, 21, and 28, showing an increasing trend over time (scale bar: 300 μm). (B) Quantification of β-gal staining comparing HGPS-ECs with HGPS-VSMCs at corresponding timepoints. Timepoints 1, 2, 3, and 4 represent in endothelial cells as Days 8, 14, 21, and 28 and in vascular smooth muscle cells as Days 30, 37, 44, and 51; n = 4. (C) Telomere probe intensities were normalized with nucleus area for control and HGPS-ECs on Days 8, 14, 21, and 28, N≥30 for each group. (D) Proliferation of endothelial cells within 10 days from both control and Hutchinson–Gilford progeria syndrome; n = 3. (E) Proliferation of vascular smooth muscle cells within 10 days from both control and Hutchinson–Gilford progeria syndrome; n = 3. (F) Quantitative reverse transcription polymerase chain reaction for inflammatory cytokines IL-1β, IL-6, TNF-α, and ICAM1 expression showed increased inflammatory cytokine expression in endothelial cells over time; n = 3–6. (G) Quantitative reverse transcription polymerase chain reaction for progerin expression over time on Days 7, 14, 21, and 28, showed a significant increase of progerin expression over time in HGPS-ECs compared with its control. n = 4–6. Statistical analysis was performed by an unpaired t-test when comparing two groups. For ≥3 groups, statistical analysis was performed using one-way analysis of variance followed by a post hoc Tukey’s test. A value of P<0.05 was considered statistically significant. *P < 0.05; **P < 0.01; ***P < 0.001; ****P < 0.0001.

