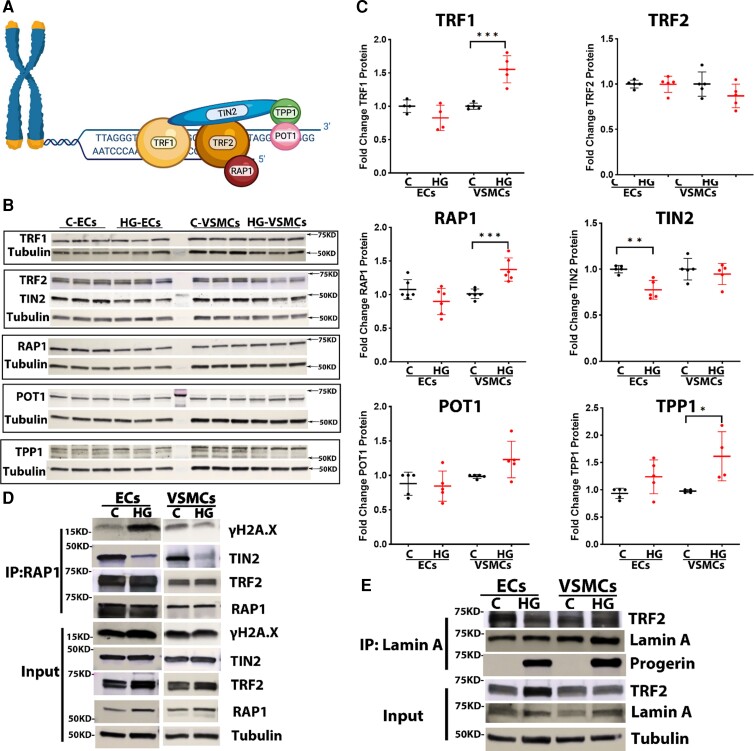
Figure 5.
Alterations in the expression and interaction of shelterin protein complexes. (A) A schematic figure of the shelterin protein complex. (B and C) Western blot for six shelterin proteins and quantification in endothelial cells and vascular smooth muscle cells from both control and Hutchinson–Gilford progeria syndrome; n = 4–6. (D) Co-immunoprecipitation of γH2A.X and TIN2 with RAP1 in both endothelial cells and vascular smooth muscle cells from control and Hutchinson–Gilford progeria syndrome; n = 3 (E) Co-immunoprecipitation of TRF2 with lamin A in both endothelial cells and vascular smooth muscle cells from control and Hutchinson–Gilford progeria syndrome; n = 3. C, control; HGPS, Hutchinson–Gilford progeria syndrome. Statistical analysis was performed by an unpaired t-test when comparing two groups. A value of P < 0.05 was considered statistically significant. *P < 0.05; **P < 0.01; ***P < 0.001.

