Figure 3.
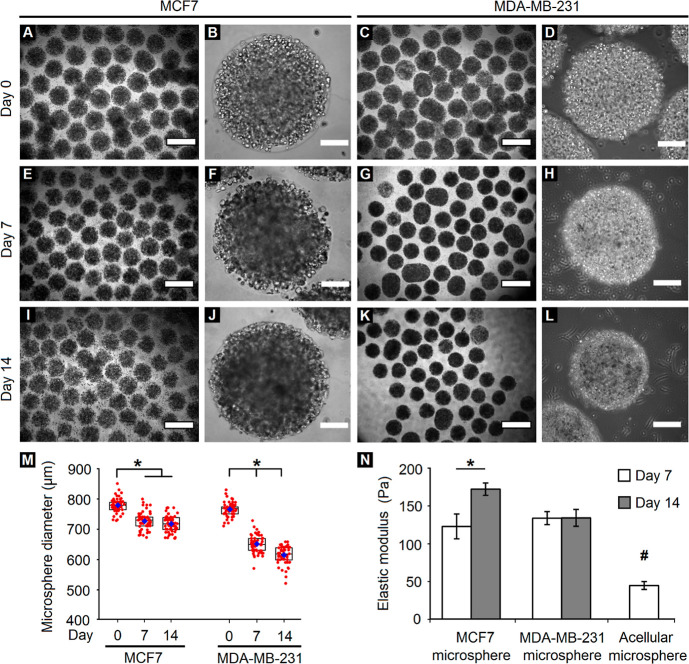
Variation in microsphere size and stiffness over time. (A–L) Phase-contrast images of breast cancer cells encapsulated within PF microspheres demonstrate variations in size distribution and cellular appearance of MCF7 and MDA-MB-231 cells. (A,C,E,G,I,K: scale bar = 1000 μm; B,D,F,H,J,L: scale bar = 200 μm). (M) Quantification of the microsphere diameter reveals a significant reduction in size for both cell types over 14 days in culture (*p < 0.05, n = minimum of 50 microspheres). Red circles denote individual microspheres, blue diamonds denote the mean, while rectangular boxes represent lower quartiles, medians, and upper quartiles of the respective groups. (N) Quantification of the elastic modulus reveals a significant increase in MCF7 microsphere stiffness but no variation in MDA-MB-231 microsphere stiffness over time. The acellular microsphere stiffness is significantly low compared to that of the cell-laden microspheres for both cell types. (*,#p < 0.05, n = 3 microspheres per group).

