Figure 5.
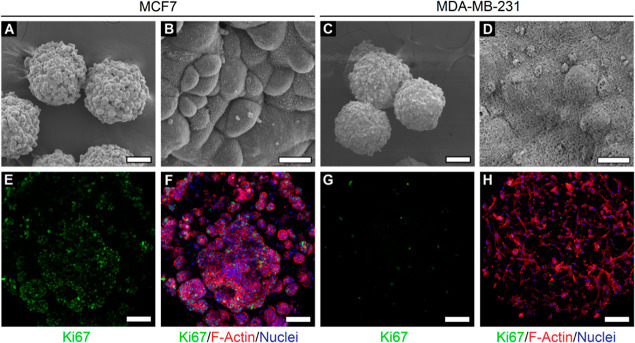
Ultrastructure and 3D morphology of cells within cancer microspheres. (A) SEM image of MCF7 microspheres reveals dense local colony formation in individual microspheres. (B) At higher magnification, MCF7 cells appear to be tightly packed within individual colonies with visible cell-surface microvillus-like features. (C) SEM image of MDA-MB-231 microspheres and (D) higher magnification image revealing individual cells (bulge-like appearance) interacting with the surrounding PF hydrogel matrix. (A,C: scale bar = 100 μm; B,D: scale bar = 10 μm). Microspheres appear smaller in size due to the shrinkage effects of SEM sample preparation. (E–H) Confocal z-projection of MCF7 and MDA-MB-231 cells reveals prominent cell-type-dependent differences in proliferation and 3D morphology (green: Ki67, red: F-actin, blue: nuclei; scale bar = 200 μm). All images were obtained on day 14 of culture.

