Figure 6.
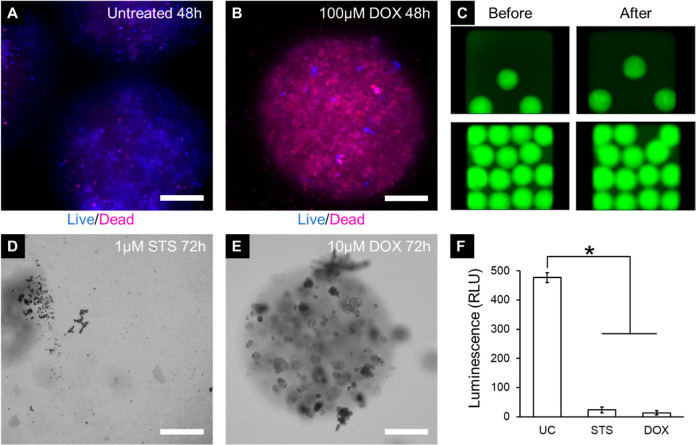
Drug testing on MDA-MB-231 microspheres. (A) Untreated microspheres for control are mostly live, whereas (B) cells treated with 100 μM doxorubicin for 48 h are mostly dead (blue: live; red: dead). Fluorescent images taken using the CellInsight CX7 high-content imaging platform. (C) Images of wells containing MDA-MB-231 microspheres before (left column) and after (right column) the pinning by a 384-pin tool mounted on Biomek NXP automated liquid handler, which is used for delivering drugs to the assay plate. Fluorescent images taken using the Cytation high-content imaging platform (Bio-Tek Inc., VT, US). (D) MDA-MB-231 microspheres treated with 1 μM staurosporine for 72 h completely degraded. Bright-field images taken using the Cytation high-content imaging platform (Bio-Tek Inc., VT, US). (E) MDA-MB-231 microspheres treated with 10 μM doxorubicin are mostly intact but with visible cell damage. (F) Assessing the viability of MDA-MB-231 microspheres after 72 h of incubation using CellTiter-Glo 3D. Bright-field images taken using the Cytation high-content imaging platform (Bio-Tek Inc., VT, US). UC—untreated control, STS—staurosporine, DOX—doxorubicin (*p < 0.05, n = 5 wells per group. Scale bar = 200 μm).

