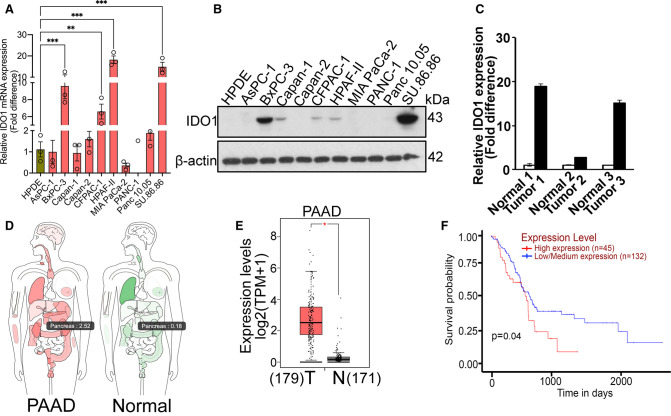
Figure 1. IDO1 is up-regulated in PDAC and affects overall patient survival.
(A) Real-time PCR showing relative IDO1 mRNA expression in HPDE cell line and 10 PDAC cell lines. (B) Western blotting showing IDO1 protein expression in normal pancreatic cell line (HPDE) and 10 PDAC cell lines. β-actin was used as an endogenous control. (C) Real-Time PCR showing relative IDO1 mRNA expression in matched PDAC primary tumors vs. the corresponding normal pancreas. (D) Interactive body map showing IDO1 expression in normal tissues and pancreatic adenocarcinoma (PAAD). (E) Box plot map showing TPM-normalized expression of IDO1 in normal tissues and pancreatic adenocarcinoma (PAAD). Since there are only four normal pancreatic samples in TCGA data, we combined them with the pancreatic samples in GTEx data. The results in D & E were generated by the online tool GEPIA (http://gepia.cancer-pku.cn/index.html). (F) Kaplan–Meier plot showing survival probability between high and low IDO1 expression in pancreatic cancer based on TCGA database. The result was generated from the online tool UALCAN (http://ualcan.path.uab.edu). Significance of survival impact is measured by log-rank test. For all in vitro studies n = 3. Data are means ± SEM. Statistical significance for (A) was assessed using one-way ANOVA followed by Dunnett's post hoc test whereas for (E), one-way ANOVA using tumor or normal as variable was used for calculating differential expression (* P < 0.05; ** P < 0.01; *** P < 0.001). T, tumor; N, normal.

