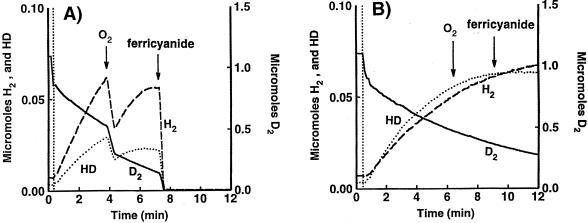
FIG. 4.
Time course of H2 and HD production and D2 consumption in the D2-H2O system by the HupSL (A) and HupUV (B) protein complexes. Cells were grown anaerobically in the light in MN medium. The H-D exchange reaction in whole cells of BSE16, a ΔhupUV mutant (2.5 mg of protein) (A), and in whole cells of JP91(pAC206), a hupSL mutant, with the hupTUV operon-containing plasmid pAC206 (5.2 mg of protein) (B), was measured in 50 mM citrate-phosphate buffer (pH 7.0). At the time indicated by the vertical dotted line, the reaction vessel was closed, and the concentrations of D2 (▄), H2 (----), and HD (····) were recorded. The arrows indicate the time of O2 appearance in the medium after H2O2 addition (2 μl of 0.3% H2O2) and the time of ferricyanide addition (10 mM). The changes in O2 concentration were monitored at a mass of 32 Da (data not shown). The figure shows the real concentrations of the hydrogen species present in the vessel.

