. 2018 Sep 25;1(1):367–377. doi: 10.1039/c8na00098k

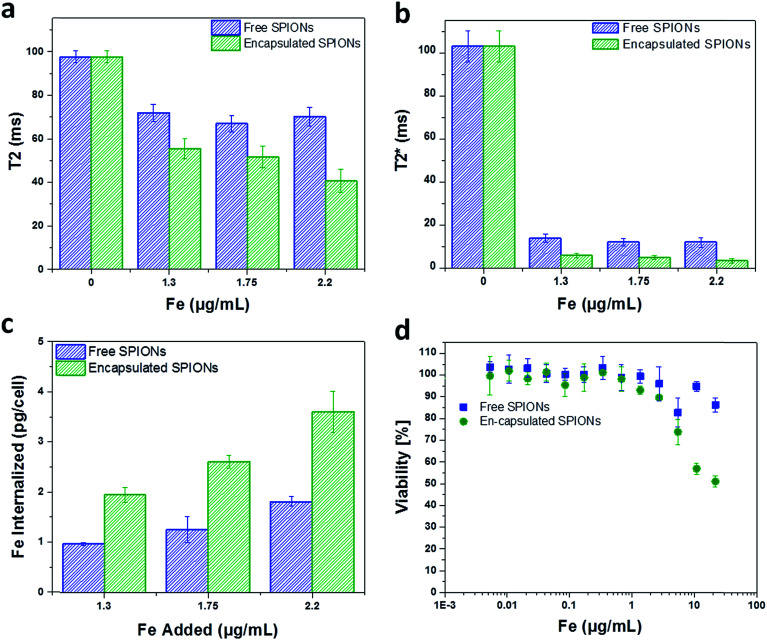
Fig. 3. Cell labelling and toxicity of SPIONs. The solution relaxation times (T2 and T2*) of the particles are plotted against the concentrations used for cell labelling (a and b). The labelling concentrations of Fe (Fe added to label the cells) are presented along abcisa. Internalization of free and encapsulated SPIONs versus the added concentration of particles used for cell labelling (determined from ferrozine assay) are shown (c). The Fe concentrations of 1.3, 1.75, and 2.2 μg mL−1 corresponds to the doses of 15, 20, and 25 capsules added per cell. Cell viability against the labelling concentrations of Fe is presented (d). The error bars are the standard deviations of three replicates.

Fig. 3