. 2018 Nov 15;1(2):728–734. doi: 10.1039/c8na00277k

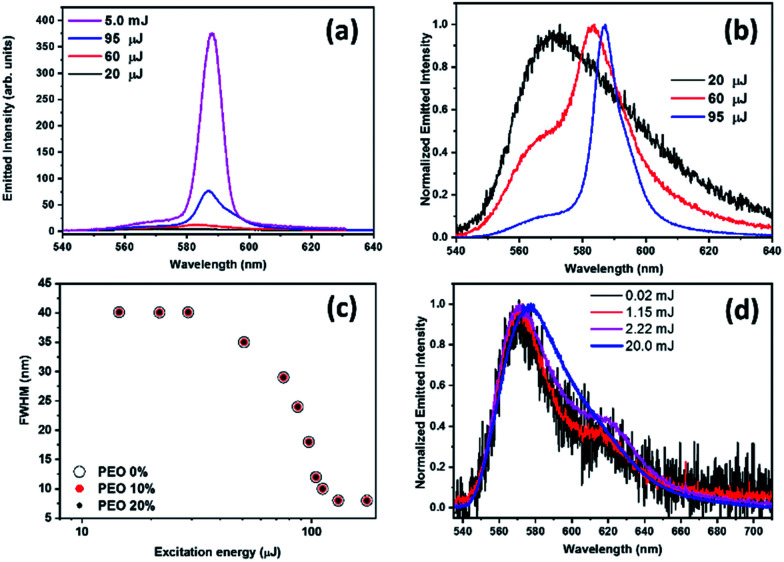
Fig. 4. (a) RL spectral emission versus excitation energy for the electrospun fibers of cellulose acetate + 10 wt% PEO (CA + 10%PEO) from below to well above the threshold. (b) Normalized emission spectra as in (a), clearly showing the bathochromic behavior from below to above the threshold. (c) Full width at half maximum (in nm) as a function of the excitation energy (μJ) for the three studied samples CA + 0% PEO (PEO-0%), CA + 10% PEO (PEO-10%) and CA + 20% PEO (PEO-20%). (d) Control experiment results on normalized fluorescent emission from PEO-100% (no CA) nanofibers, where no RL emission is observed (no linewidth narrowing), for powers from below to above the threshold.

Fig. 4