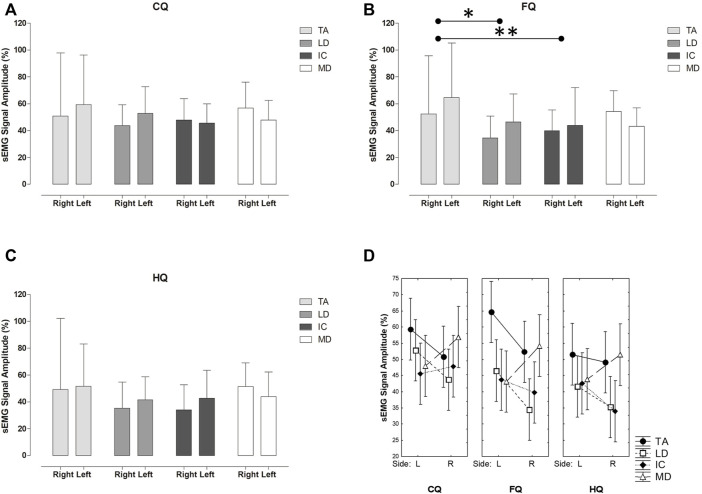
FIGURE 4.
Mean (±SD) of relative sEMG signal amplitude (%) comparing the TA, LD, CI, MD muscles bilaterally for the (A) classic quadruped (CQ) (B) functional quadruped (FQ) (C) homolateral quadruped (HQ) and between the hemibody sides for the three postures (D); *p = 0.01; **p = 0.03. Hemibody sides: L: Left; R: Right.

