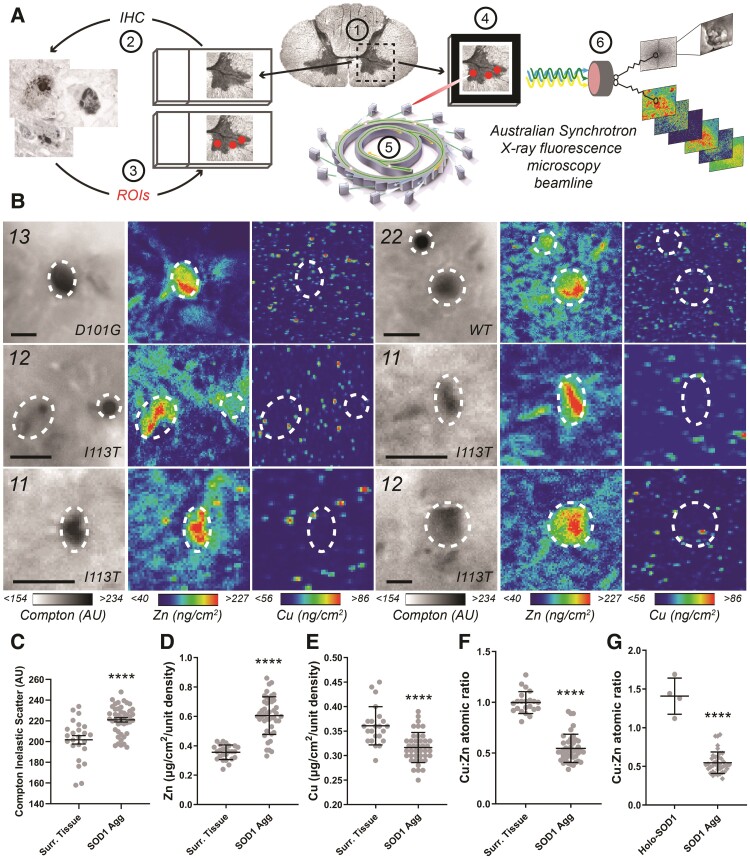
Figure 4.
Cu:Zn ratios within individual SOD1 aggregates are distinct from purified soluble mature SOD1. (A) Experimental workflow for identifying and analysing SOD1 aggregate metal content in post-mortem spinal cord tissues from ALS patients. Following serial sectioning of frozen post-mortem spinal cord tissues onto alternating Superfrost slides and Si3N4 synchrotron grids (1), SOD1 aggregates were immunostained on Superfrost slides using B8H10 conformation-specific SOD1 antibody (2) and their locations mapped as regions of interest (ROI) using an Olympus Slide Scanner (3). Tissue maps containing regions of interest were superimposed over differential interference contrast images of facing, serial, unstained frozen tissue sections mounted on Si3N4 grids (4). Synchrotron radiation was directed at regions of interest within unstained tissues mounted on Si3N4 grids using the XRF microscopy (XFM) beamline of the Australian Synchrotron (5) and XRF emission spectra and Compton scatter spectra collected by the Maia detector (6). (B and C) Compton scatter and XFM images of representative SOD1 aggregates in the ventral spinal cord (VSpC) of three SOD1-fALS and one sALS case (B). Scale bars = 10 µm, regions of interest are marked by white dashed circles. Case numbers and SOD1 mutations are listed in the top left corner of each panel. Higher Compton scatter values, represented by darker pixels, signify greater tissue matter densities in SOD1 aggregates compared with surrounding ventral horn grey matter tissue (Surr. Tissue; C; Unpaired t-test; P < 0.0001, t = 4.731, df = 66). (D–G) Zinc was increased by 70% (D; Unpaired t-test; P < 0.0001, t = 9.339, df = 67) and copper reduced by 12% (E; Unpaired t-test; P < 0.0001, t = 5.012, dfCu:Zn = 62), within SOD1 aggregates compared with surrounding grey matter tissues, resulting in a significant decrease in the atomic ratio of within SOD1 aggregates compared with surrounding tissues (F; Mann–Whitney U-test; P < 0.0001, U = 8.5) and the Cu:Zn ratio of soluble mature SOD1 measured in these cases (G; Mann–Whitney U-test; P < 0.0001, U = 0). Data in C–G represent mean ± SEM. ****P < 0.0001.

