Figure 1.
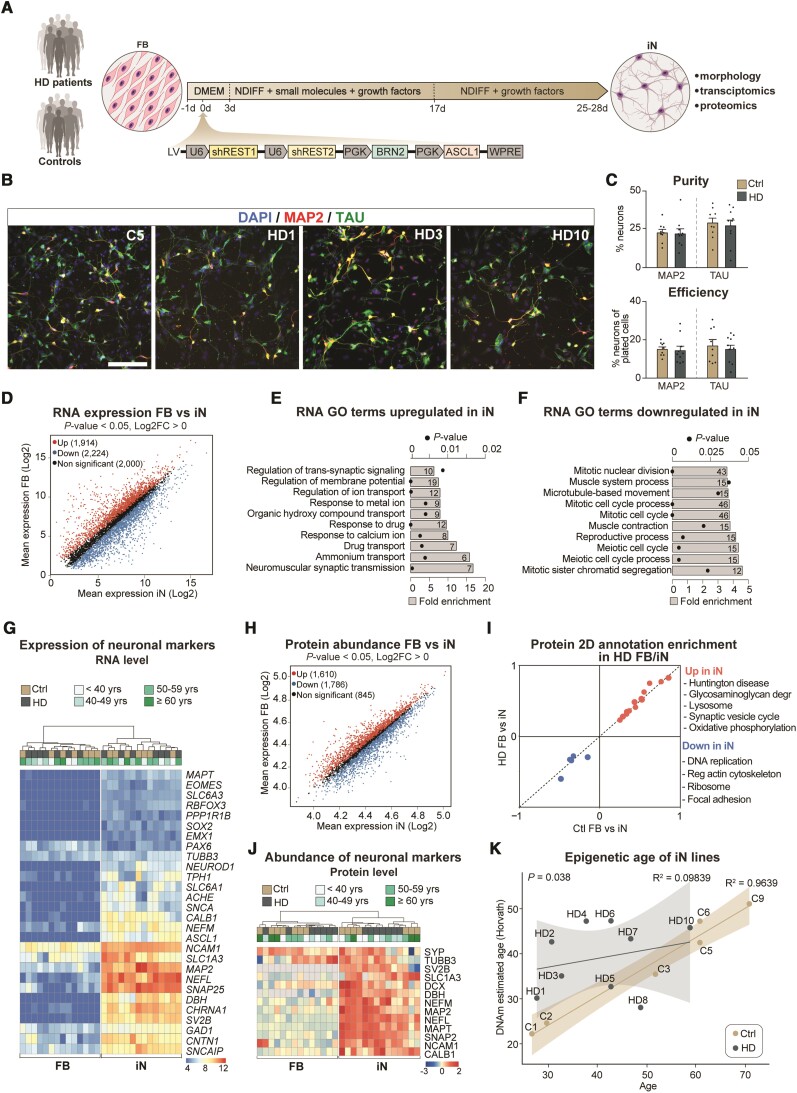
Huntington’s disease fibroblasts readily convert into induced neurons with similar purity and conversion efficiency. (A) Experimental overview of the induced neuron (iN) conversion. (B) Induced neurons derived from control and Huntington's disease patient fibroblasts both express mature neuronal markers like TAU and MAP2. (C) Percentage of MAP2+ or TAU+ neurons from DAPI+ cells. Each dot represents the average value for one control or Huntington's disease cell line. Percentage of MAP2+ or TAU+ neurons from plated cells after conversion (n = 9 lines for controls, 81 wells analysed for MAP2 in total and 78 for TAU; n = 10 lines for Huntington’s disease, 85 wells analysed in total for MAP2 and 77 for TAU). (D) Scatter plot displaying RNA-sequencing log2 mean gene expression in induced neurons (x-axis) and fibroblasts (y-axis). Significantly upregulated genes in induced neurons compared to fibroblasts are shown in red, significantly downregulated genes are shown in blue, and non-significant genes in black (n = 7 control and n = 7 Huntington’s disease fibroblast and induced neuron lines). (E and F) Gene ontology overrepresentation test of biological processes (Fisher's exact test using PANTHER GO-slim biological process) of genes up or downregulated in induced neurons compared to fibroblasts (differential gene expression analysis performed with DESeq2; Padj < 0.05, log2FC > 1), top 10 most significant terms are shown. Bar plots represent fold enrichment. Circles represent Benjamini-Hochberg false discovery rates (n = 7 control and n = 7 Huntington’s disease fibroblast and induced neuron lines; FDR < 0.05). (G) Heat map of RNA expression of neural markers (n = 7 control and n = 7 Huntington’s disease fibroblast and induced neuron lines; normalized by mean of ratios, Padj <0.05). (H) Scatter plot displaying mean protein abundance in induced neurons (x-axis) and fibroblasts (y-axis). Proteins with statistically significant differences between groups were highlighted in red (upregulated in neurons) or blue (downregulated in neurons). Proteins that were not found significantly different are shown in black (n = 7 control and n = 7 Huntington’s disease fibroblasts and induced neuron lines). (I) 2D annotation enrichment analysis of biological pathways between induced neurons and fibroblasts from Huntington's disease patients and healthy donors. Significant pathways were selected following a threshold of 0.02 (Benjamini-Hochberg FDR). (J) Heat map of protein abundance of neural markers (n = 7 control and n = 7 Huntington’s disease fibroblast and induced neuron lines; normalized counts, Padj < 0.05). (K) Scatter plot of chronological age in years (x-axis) versus DNAm predicted age (y-axis) with regression curves and 95%-confidence intervals plotted separately for control and HD-iNs (n = 6 for control and n = 9 for HD-iN lines; Pearson correlation coefficient R2 = 0.9639 for control and 0.09839 for HD-iN lines). *P < 0.05; two-tailed unpaired t-tests were used. All data are shown as mean ± SEM. Scale bar = 50 µm. See also Supplementary Figs. 1 and 2. FB = fibroblast; GO = gene ontology; iN = induced neuron; DMEM = Dulbecco's modified Eagle medium; Ndiff = Neural differentiation medium; sh = short hairpin; REST1/2 = RE1/2-silencing transcription factor; PGK = Phosphoglycerate kinase promoter; BRN2 = POU Class 3 Homeobox 2; ASCL1 = Achaete-Scute Family BHLH Transcription Factor 1; WPRE = Woodchuck Hepatitis Virus Posttranscriptional Regulatory Element.

