Figure 6.
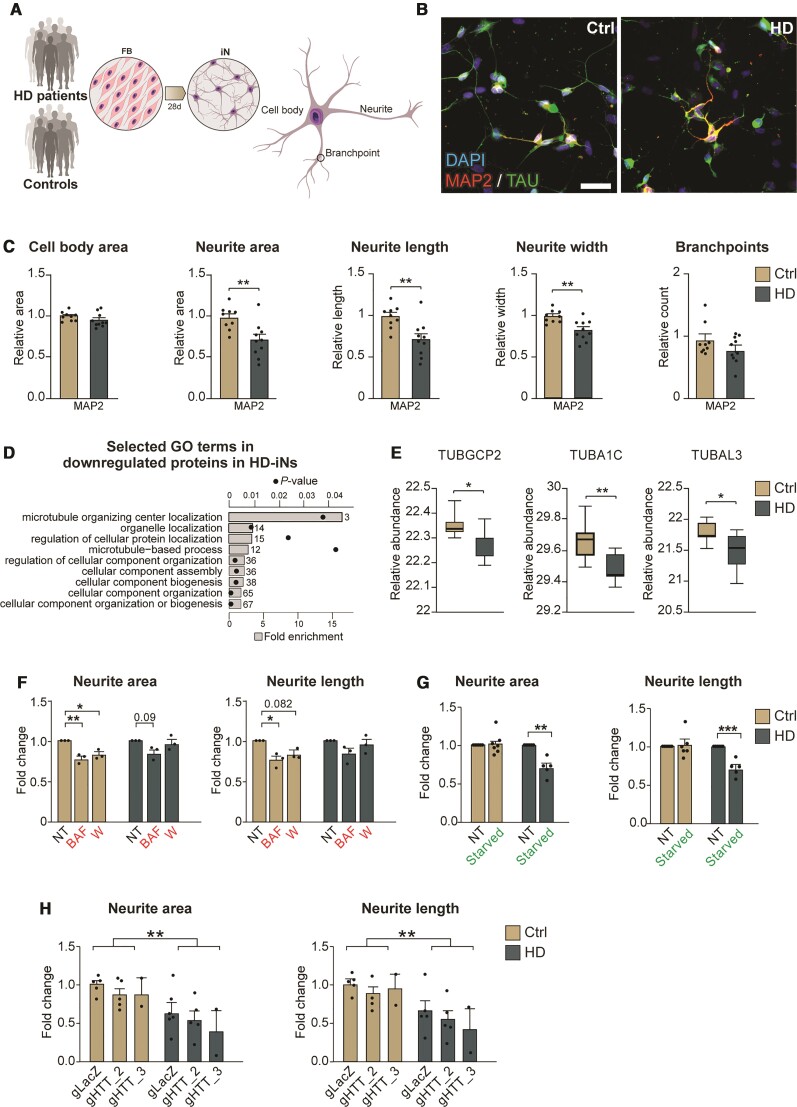
HD-iNs show a less elaborate neuronal morphology. (A) Experimental workflow summarizing iN conversion. After neural conversion, morphology of the cells is analysed using high-content automated microscopy analysis. (B) Representative images after 28 days of conversion showing control and HD-iNs expressing mature neuronal markers like MAP2 and TAU. (C) The average relative cell body area and number of branchpoints per cells as defined by MAP2 staining using high-content automated microscopy analysis shows no difference between control and HD-iNs. Relative neurite area, length and width per cell was significantly reduced in the HD-iNs compared to the healthy controls (n = 9 lines for controls, 96 wells analysed in total; n = 10 lines for HD, 119 wells analysed in total). (D) Biological processes connected to microtubules and cytoskeletal organization selected from the gene ontology functional enrichment analysis (STRING, biological process) of proteins downregulated in HD-iNs compared to Ctrl-iNs. Bar plots represent fold enrichment. Circles represent P-values (n = 7 control and n = 7 Huntington’s disease fibroblast and induced neuron lines; P < 0.05). (E) Tubulin proteins significantly dysregulated between control and HD-iNs (n = 7 control and n = 7 HD-iN lines). (F) Neurite area and length per cell is reduced after autophagy impairment in control iNs, while it is not further reduced in HD-iNs (n = 3 control and n = 3 HD-iN lines, 9–9 wells analysed in each condition). (G) Neurite area and length per cell is reduced after starvation in HD-iNs, while it is not changed in control iNs (n = 6 for Ctrl-iN lines and n = 5 for HD-iN lines, 12 wells analysed in total for Ctrl-iNs and 10 for HD-iNs). (H) Relative neurite area and length per cells were not changed in the HTT (wild-type and mutant) silenced HD-iNs compared to the LacZ transduced. HTT silencing did not affect neurite area and length in the control induced neurons (n = 5 control and n = 5 HD-iN lines for LacZ and gRNA2, n = 2 control and n = 2 HD-iN lines for gRNA3). ***P < 0.001; **P < 0.01; *P < 0.05; two-tailed unpaired T-tests were used in C, E and G. Ordinary one-way ANOVA was used in F. Two-way ANOVA was used in H. All data are shown as mean ± SEM in C and F–H. All data are shown as min/max box plots in E. Scale bar = 50 µm. See also Supplementary Fig. 10.

