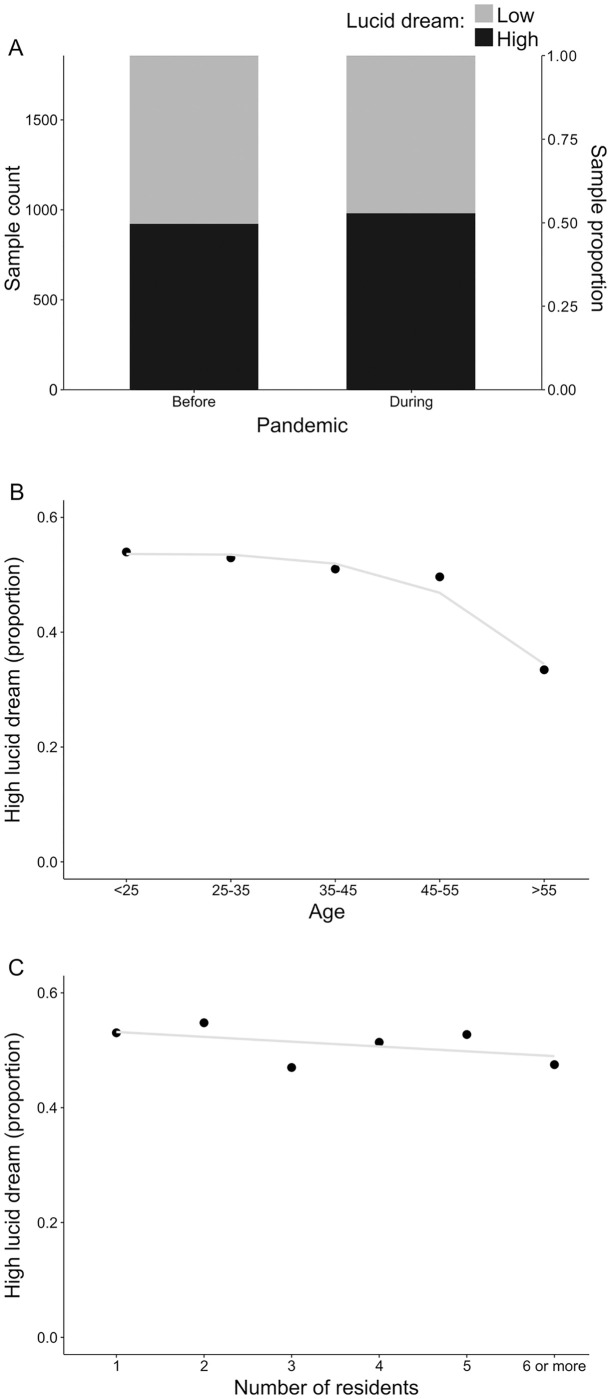
Fig 2. Representation of main effects unveiled by the mixed logistic statistical model.
(A) The proportion of high lucid dreamers before and after the pandemic. (B) The proportion of respondents declaring high frequency of lucid dreams according to the corresponding category for age. Because these categories are somewhat arbitrary, a rough smoothing for the relation between the variables (blue line) was added to the plot to improve interpretation. (C) The proportion of high lucid dreamers conditioned to the number of residents sharing the house. In the absence of any clearer representation, the relationship between these variables is summarized by a straight (blue) line to enhance visual inspection.

