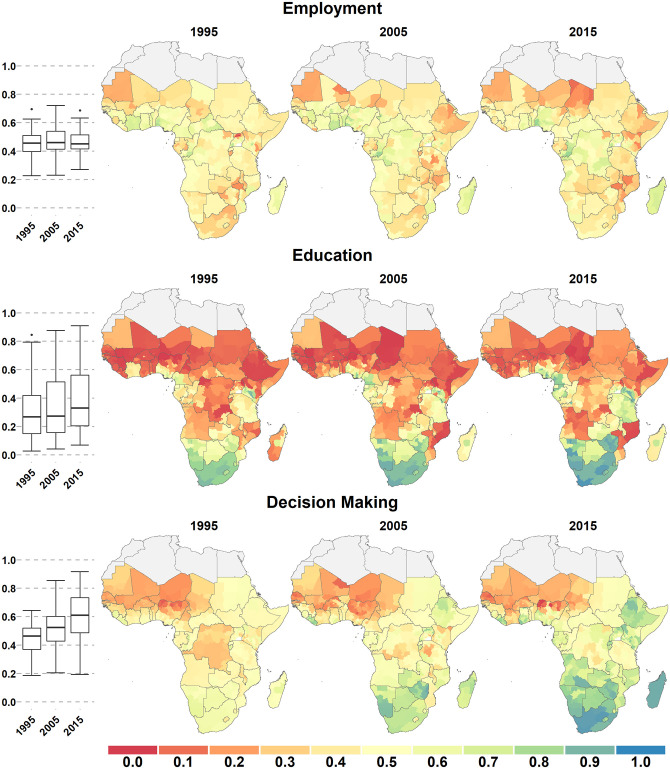
Fig 2. Employment (a), Education (b), and Decision-Making (c).
Scores for three female empowerment domains across Sub-Saharan Africa in 1995, 2005, and 2015. Scores can range from 0 (no empowerment) to 1 (full empowerment) and are shown for first-level administrative subdivisions. Boxplots (left) show the range and quartiles scores for each domain.

