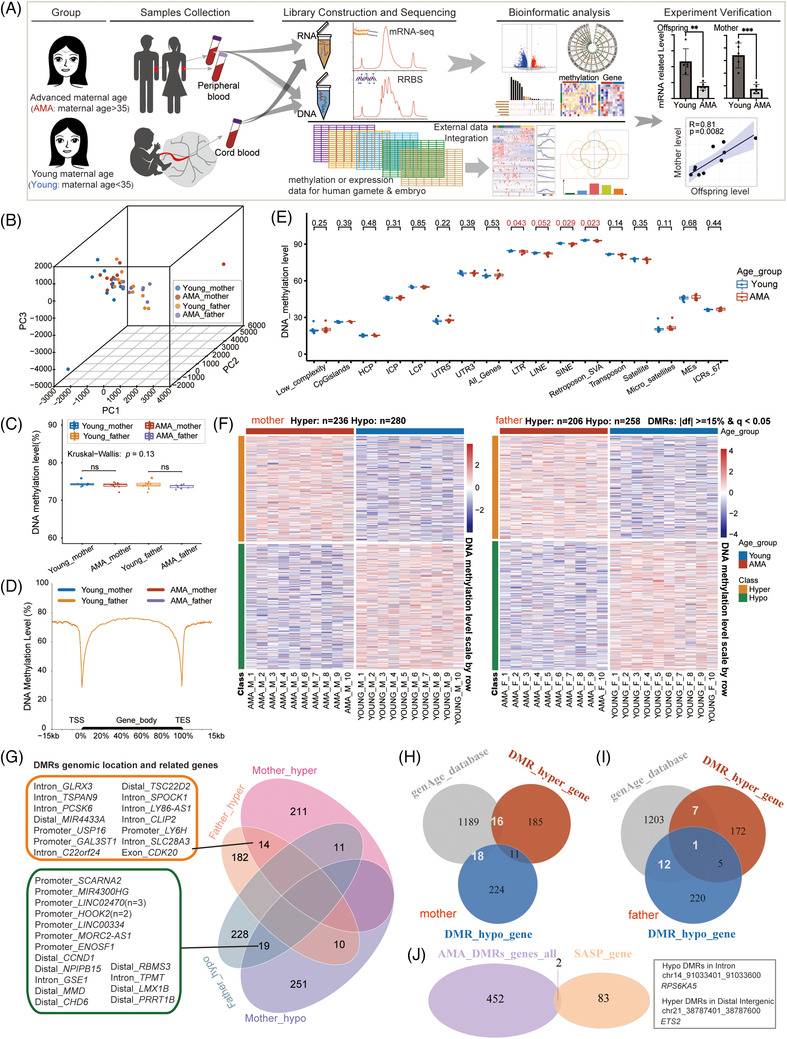
FIGURE 1.

Distinct advanced maternal age (AMA)‐related DNA methylation changes in the mother and father groups. (A) Flowchart of the experiment and data analysis. (B) Three‐dimensional scatter plot showing the distribution of parental samples in the four groups (AMA‐mother, Young‐mother, AMA‐father, Young‐father). The first three principal components from principal components analysis (PCA) based on the 200 bp tiles DNA methylation pattern (n = 701937) were used; sample size: n = 40. (C) Box plot showing the distribution of DNA methylation level in four groups. Each dot represents the average DNA methylation level of each sample; the p value between AMA and Young groups was determined by Wilcoxon rank‐sum test. (ns: p > .05); the p value for the comparison among multiple groups was determined by Kruskal–Wallis test. (D) Mean DNA methylation levels along with the gene bodies, and 15 kilobases (kb) upstream of the transcription start site (TSS) and 15 kb downstream of the transcription end site (TES) of all genes. (E) Box plot presenting the distribution of the average DNA methylation level of specific genome elements in the AMA‐mother group (red) and Young‐mother group (blue); each dot represents the average DNA methylation level for each sample; the p value between the AMA and Young groups was determined by the Wilcoxon rank‐sum test. (F) Heatmap showing the DNA methylation of AMA‐related differentially methylated regions (DMR) in the mother group (left) and father group (right). Blue bars represent the Young group, and red bars represent the AMA group. Orange bars represent hyper DMRs, while green bars represent hypo DMRs. (G) Venn diagram showing the numbers of overlapping and nonoverlapped DMRs among the four groups; the corresponding relative genic location and nearby gene for each DMR in the targeted categories are presented on the left. Distal stands for distal intergenic. (H, I) Venn diagram showing the number of intersections between genes provided by the genAge database and genes near AMA‐DMRs in either the mother groups (H) or the father group (I). (J) Venn diagram showing the number of intersections between genes near AMA‐DMRs and senescence‐associated secretory phenotype genes in the mother groups. The relative genic locations and concrete genomic coordinates for the corresponding DMRs of overlapping genes are presented on the right (ns: p > .05, ∗p < .05; ∗∗p < .01, ∗∗∗p < .001).
