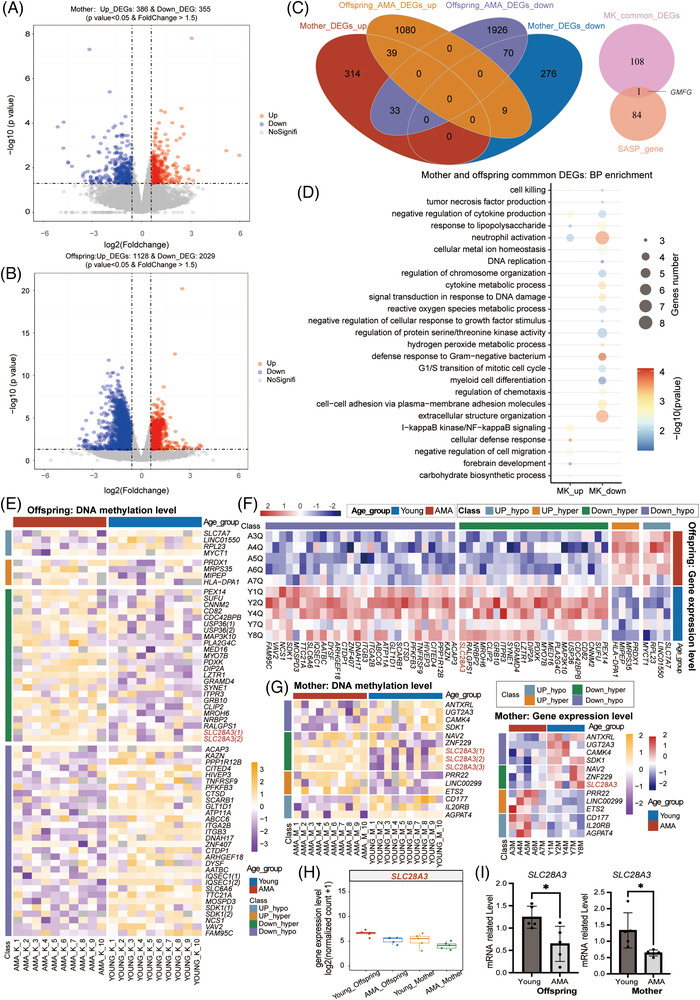
FIGURE 3.

Advanced maternal age (AMA)‐related transcriptional alterations in the mother and offspring. (A, B) Volcano plot simultaneously displaying the p value and the fold change in gene expression level in the comparison between the AMA and Young groups for either the mother (A) or offspring (B) groups. Red dots and blue dots represent the upregulated and downregulated DEGs identified between the AMA group and Young group; light grey dots refer to genes with no significant change. (C) Venn diagrams displaying the number of overlapping or no‐overlapping AMA‐DEGs between the mother and offspring groups (left), and the number of intersections between senescence‐associated secretory phenotype genes and common DEGs in mother and offspring groups (right). (D) Bubble chart showing representative Gene Ontology (GO) terms for common AMA‐DEGs mentioned in (C). The gene number in all enrichment terms was not less than three, with a p value < .05. The p value was measured by hypergeometric test. (E–G) Heatmap showing the DNA methylation level of AMA‐related (differentially methylated regions) DMRs whose nearest genes belonged to AMA‐DEGs in either the offspring group (E) or in the mother group (G, left) or the gene expression level of AMA‐DEGs overlapped with genes near AMA‐DMRs in either the offspring group (F) or in the mother group (G, right). Blue bars indicate the Young group, and red bars indicate the AMA group. Gray and orange bars indicate Up‐DEGs overlapping with genes near hypo DMRs and genes near hyper DMRs, respectively. Green and purple bars indicate Down‐DEGs overlapping with genes near hypo DMRs and genes near hyper DMRs, respectively. (H) Box diagram showing the gene expression level of SLC28A3 in the four groups (AMA‐Offspring, Young‐Offspring, AMA‐mother, Young‐mother). (I) Column diagram displaying the relative gene expression level of SLC28A3 determined by qRT‐PCR in the AMA and Young groups for either neonatal samples (left) or maternal samples (right). Each dot represents the relative gene expression level of each sample; error bars refer to the standard deviation. The p value between the AMA and Young groups was determined by unpaired t‐test (∗p < .05).
