. 2022 Aug 19;13(35):10238–10250. doi: 10.1039/d2sc03565k

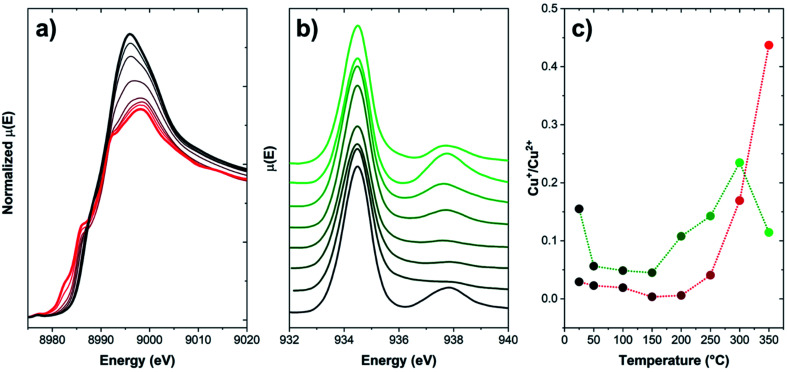
Fig. 7. (a) Normalized Cu K-edge XANES of a Cu-CHA sample (Si/Al = 5, Cu/Al = 0.3), collected during heating from RT to 350 °C (temperature evolution from black to red) under a He flow; (b) Cu L3-edge TEY NEXAFS spectra of the same sample, collected during heating from RT to 350 °C (temperature evolution from black to green) under a He flow; and (c) Cu+/Cu2+ fraction from both techniques reported as a function of temperature. Fractions for XANES have been computed on the basis of data from ref. 86. Fractions for NEXAFS have been estimated as the intensity ratio of the features associated to Cu+ (ca. 938 eV) and Cu2+ (ca. 934.5 eV). Unpublished figure reporting data from ref. 86 and unpublished data.

Fig. 7