. 2022 Feb 2;13(35):10177–10192. doi: 10.1039/d1sc06782f

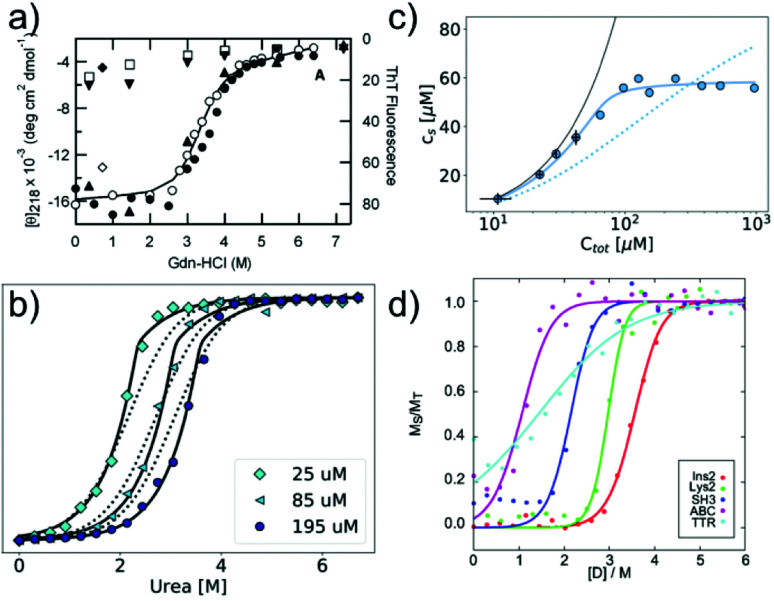
Fig. 3. Chemical depolymerisation of amyloid fibrils. (a) One of the earliest such data sets, in which β2-microglobulin amyloid fibrils have been destabilised by GndHCl and the depolymerisation has been followed by CD spectroscopy and ThT fluorescence. Reproduced from ref. 80 with permission from Elsevier, copyright 2004. (b) Global fit of chemical depolymerisation (by urea) of glucagon amyloid fibrils, followed by intrinsic fluorescence. It can be seen that a better fit is achieved with the cooperative linear polymerisation model (solid line) than with the simpler isodesmic linear polymerisation model (dotted line). (c) The dependence of the soluble concentration on the total concentration of glucagon amyloid fibrils is measured at 3 M urea (compare with panel b). In this type of experiment, the isodesmic model does not describe the data. (b) and (c) Reproduced from ref. 41 with permission from the RSC, copyright 2019. (d) Chemical depolymerisation analysis of different amyloid peptides and proteins revealed that the per-residue stability of amyloid fibrils is the highest for short sequences. Reproduced from ref. 81 with permission from the ACS, copyright 2019.

Fig. 3