. 2022 Jul 23;13(35):10281–10290. doi: 10.1039/d2sc03443c

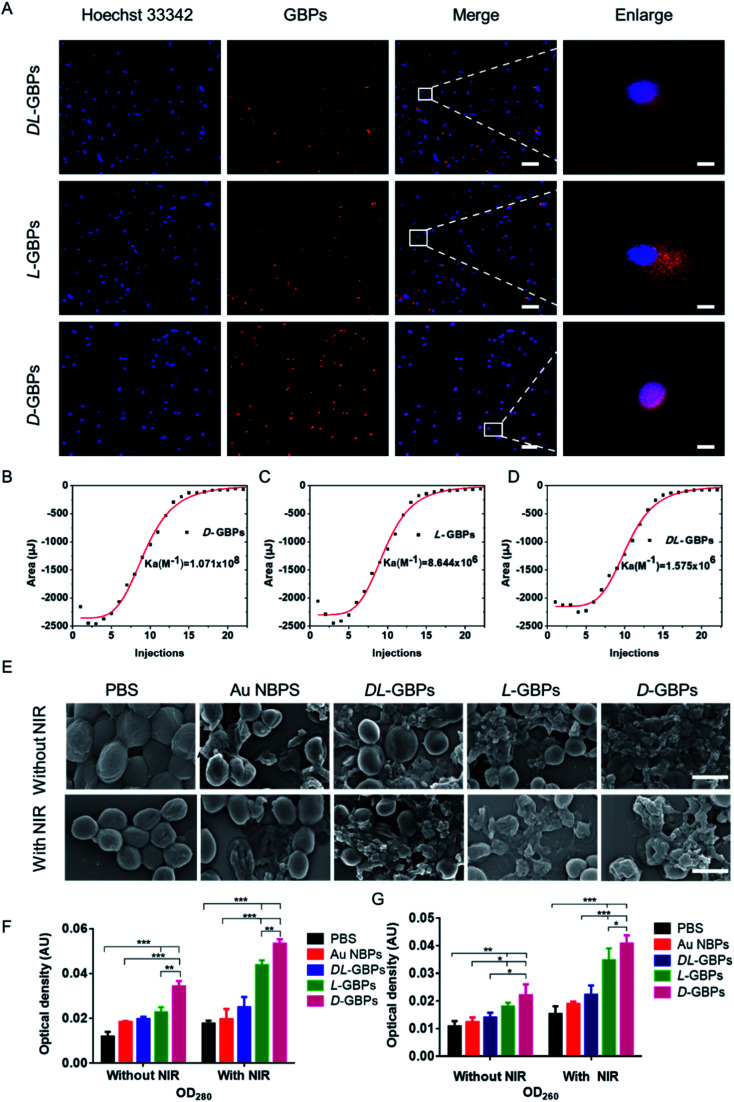
Fig. 3. Evaluation of antibacterial mechanism of d-/l-GBPs. (A) After material treatment, confocal fluorescence imaging was performed on Staphylococcus aureus and GBPs. The white dotted line part is the enlarged area of each bacterial image. Scale bar: 5 μm and 500 nm. The integrated heat data with respect to time for the titration of (B) d-GBPs, (C) l-GBPs and (D) dl-GBPs to protein A in the cell wall of Staphylococcus aureus. (E) SEM images of Staphylococcus aureus after various treatments. Scale bar: 1 μm. (F) The nucleic acid and (G) protein leakage of Staphylococcus aureus were treated by different methods by measuring the optical density. ***p < 0.001, **p < 0.01 and *p < 0.05.

Fig. 3