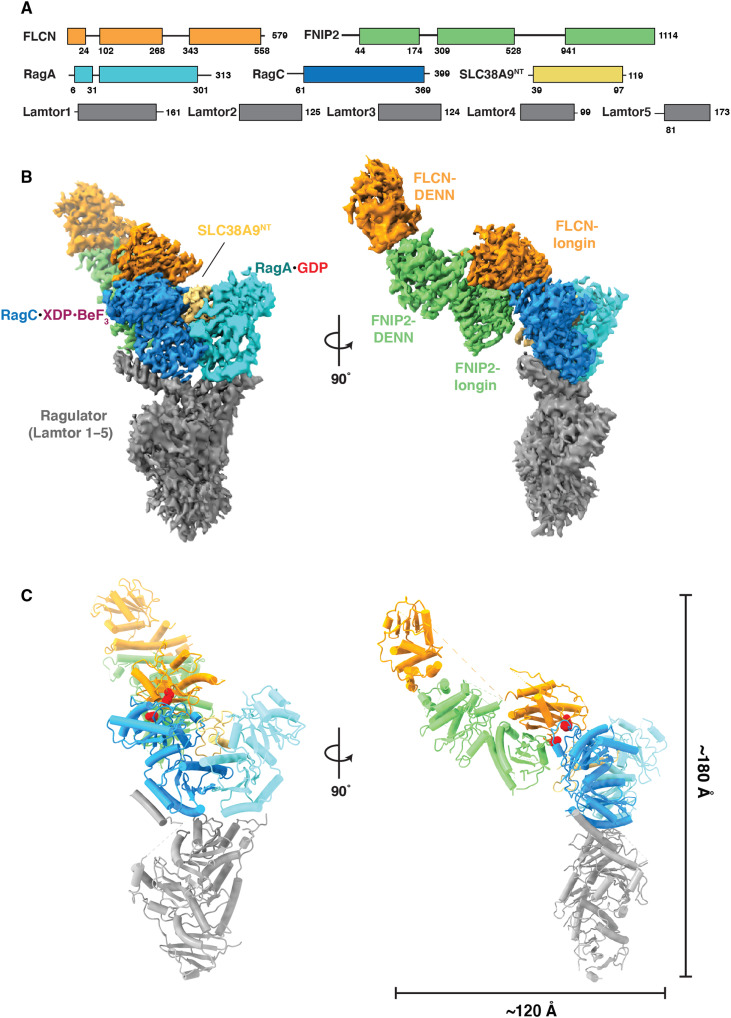
Fig. 2. Cryo-EM structure of the active FLCN complex.
(A) Domain organization for components of AFC. (B) Composite map for complex. Focused map of interface was combined with the overall map to produce a composite map containing the highest-resolution information for each component. (C) Reconstructed model for AFC with overall dimensions of the side view of the complex. Dotted regions in the model represent unstructured regions in FLCN connecting the two domains. Red spheres indicated locations of mutations in FLCN F10D and FNIP2 V146E.

