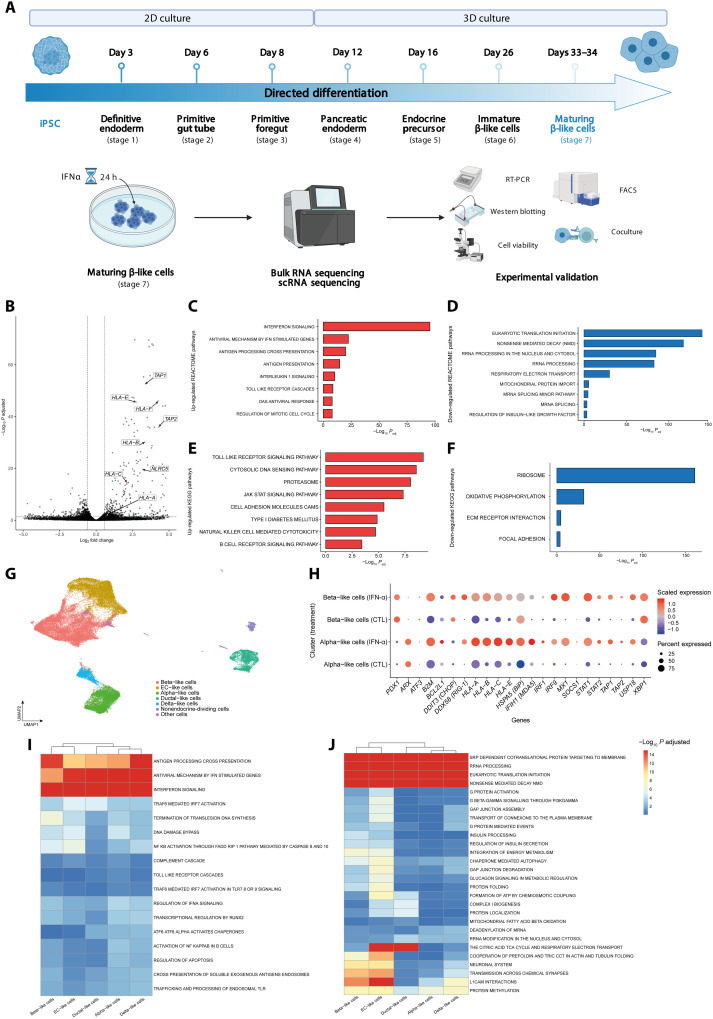
Fig. 1. Single-cell and bulk RNA-seq of iPSC-derived islet-like cells.
(A) Experimental design of the iPSCs differentiation and subsequent exposure to IFNα. Stage 7 cells were exposed to IFNα during 24 hours; n = 5. FACS, fluorescence-activated cell sorting. (B) Volcano plot of the differentially expressed genes induced by IFNα after 24 hours of exposure. Paired experiments (n = 5) were analyzed using DESeq2 to determine differentially expressed genes. Each gene was plotted as (log2FC) (x axis) and −log10(adjusted P) (y axis). The horizontal dashed line indicates cutoff of −log10(adjusted P) > 1.3 (adjusted P < 0.05), and the horizontal dashed lines indicate |log2FC| > 0.58. (C to F) GSEA analysis following differential gene expression (DGE) analysis of β-like cells exposed to IFNα; REACTOME (C and D) and KEGG (E and F) show enriched and depleted gene sets. Selected pathways are shown as bar plots with −log10(P) on the x axis. (G) Uniform Manifold Approximation and Projection (UMAP) embedding of 73,834 integrated cells exposed, or not, to IFNα. (H) Expression of key IFNα-induced genes in β-like and α-like cells. The size of the dots indicates % of cells expressing the gene of interest, while the color scale indicates level of expression. (I and J) GSEA analysis in iPSC β-like cells following exposure to IFNα shows a heterogeneous response. After differential gene expression using MAST, results were input in fGSEA to determine enriched (I) or depleted (J) REACTOME pathways. −Log10(adjusted P) values were capped at 15. Hierarchical clustering based on those values was performed to highlight the (dis)similarity in response of identified cell types.

