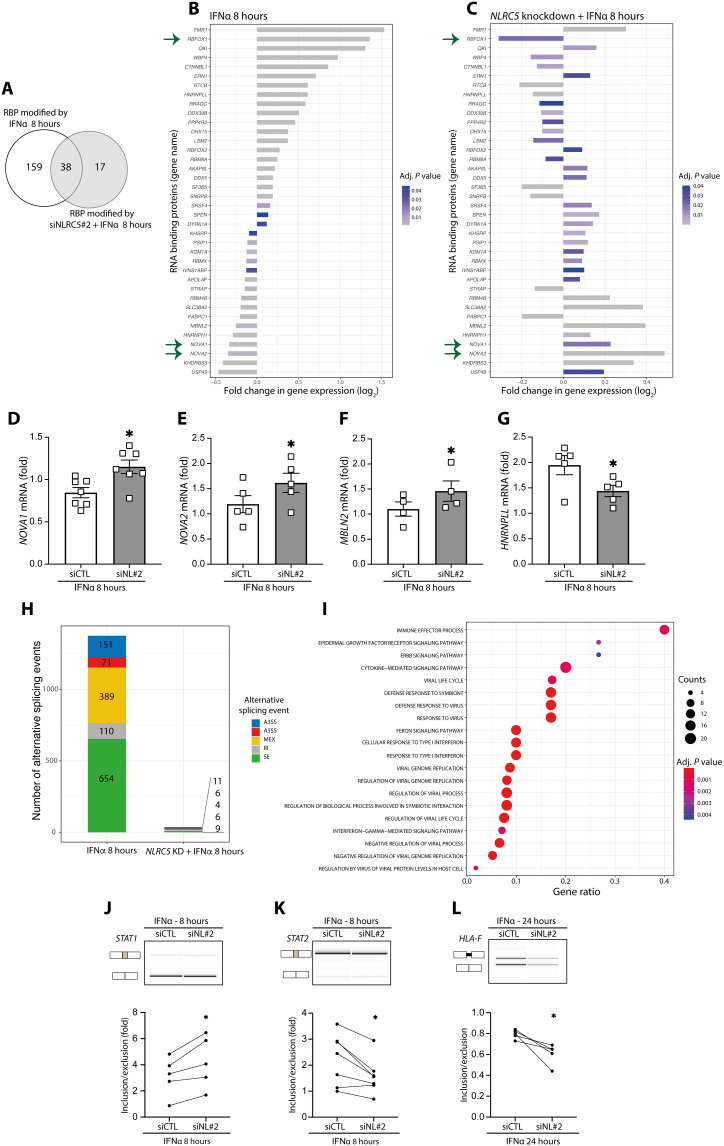
Fig. 8. NLRC5 depletion attenuates the impact of IFNα-induced (8 hours) alternative splicing modifications in EndoC-βH1 cells.
(A) Venn diagram of the overlap between RNA binding proteins (RBPs) modified by exposure to IFNα with or without NLRC5 silencing. (B and C) mRNA expression of RBPs in cells exposed to IFNα alone (B) or with NLRC5 silencing (C). Bar charts depict log2-transformed FC (adjusted P < 0.05). Arrows indicate relevant RBPs modified by IFNα (B) but prevented by NLRC5 KD (C). (D and E) mRNA expression analyzed by quantitative RT-PCR of selected RBPs regulated by IFNα and NLRC5 depletion: (D) NOVA1, (E) NOVA2, (F) MBNL2, and (G) HNRNPLL; mRNA expression was normalized by the geometric mean of GAPDH and β-actin; means ± SEM of four to seven independent experiments. *P < 0.05 (paired t test). (H) Cells were exposed to IFNα or to IFNα following NLRC5 silencing (NLRC5 KD). A3ss, alternative 3′ splice site; A5ss, alternative 5′ splice site; MEX, mutually exclusive exons; RI, intron retention; SE, skipped exons. (I) Gene Ontology (GO) enrichment of the genes with modified alternative splicing events in cells treated with IFNα for 8 hours. Gene ratio indicates % of total genes with AS modifications in the given GO term (adjusted P < 0.05). (J to L) Confirmation by semiquantitative RT-PCR of IFNα and NLRC5 KD-regulated splicing in selected genes (STAT1, STAT2, and HLA-F). Representative digital gel images (top) and quantifications with paired individual data points for five to seven independent experiments (bottom) are shown for each splicing event. *P < 0.05 (paired t test).

