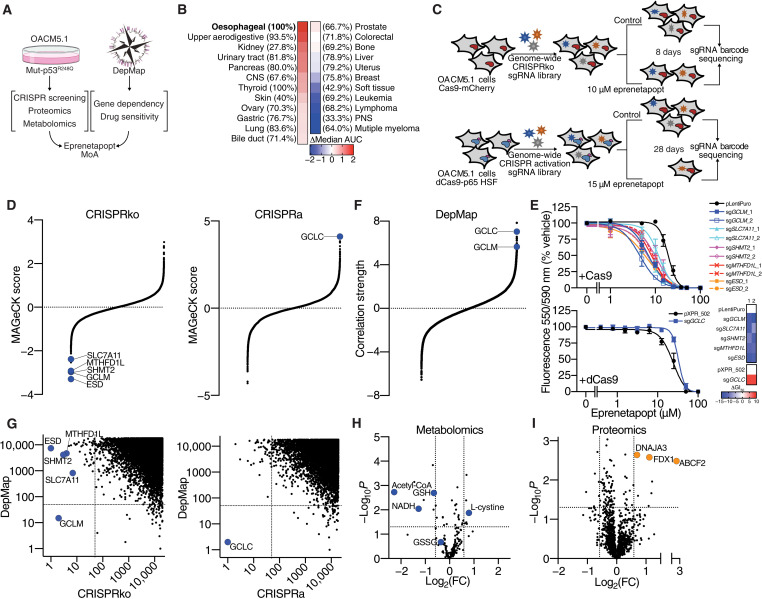
Fig. 1. Multiomics strategy to determine the MoA of eprenetapopt.
(A) Schematic diagram showing a strategy to determine the MoA of eprenetapopt. (B) Heatmap of sensitivity to eprenetapopt analog (APR-017). Cancer lineages are ordered by sensitivity determined by delta median, area under the curve (AUC) of compound activity. Percentages denote the frequency of TP53 mutations in each lineage. CNS, central nervous system; PNS, peripheral nervous system. (C) Schematic showing the workflow for the CRISPRko and CRISPRa screens in OACM5.1 cells. (D) MAGeCK scores (negative indicating dropout and positive indicating “enrichment”) from CRISPR screens, plotted in order of magnitude. (E) Cellular metabolic activity measured by alamarBlue as a surrogate readout for cell viability following 72-hour exposure with eprenetapopt at indicated doses in cells transduced with individual sgRNA targeting identified hits. Heatmap represents the change in GI50 (dose where 50% growth inhibition is achieved) relative to control. (F) Fisher’s transformed z-scored Pearson correlation strength of gene dependency from the DepMap database with eprenetapopt analog (APR-017) sensitivity data from CTRPv2, plotted in order of magnitude. (G) Comparison of CRISPR screens and DepMap gene dependency data shows overlay of glutamate-cysteine ligase units (GCLC and GCLM). Plot is representing the rank of top hits (ordered by dropout in CRISPRko, by enrichment in CRISPRa, and by positive correlations in DepMap). Dashed lines indicate overlap of top 50 ranked genes. (H) Changes in polar metabolites determined by untargeted liquid chromatography–mass spectrometry (LC-MS) metabolomics and (I) proteins determined by label-free quantitative proteomics in OACM5.1 cells following treatment with 50 μM eprenetapopt for 12 hours compared to vehicle. Dotted lines indicate significance cutoffs {P < 0.05, |log2[fold change (FC)]| > 0.5}. Two-tailed unpaired t test (H and I). Error bars = SEM. (D) n = 2 for CRISPRko, n = 1 for CRISPRa, (E) n = 3 to 4, (H) n = 6, and (I) n = 4. See also fig. S1.

