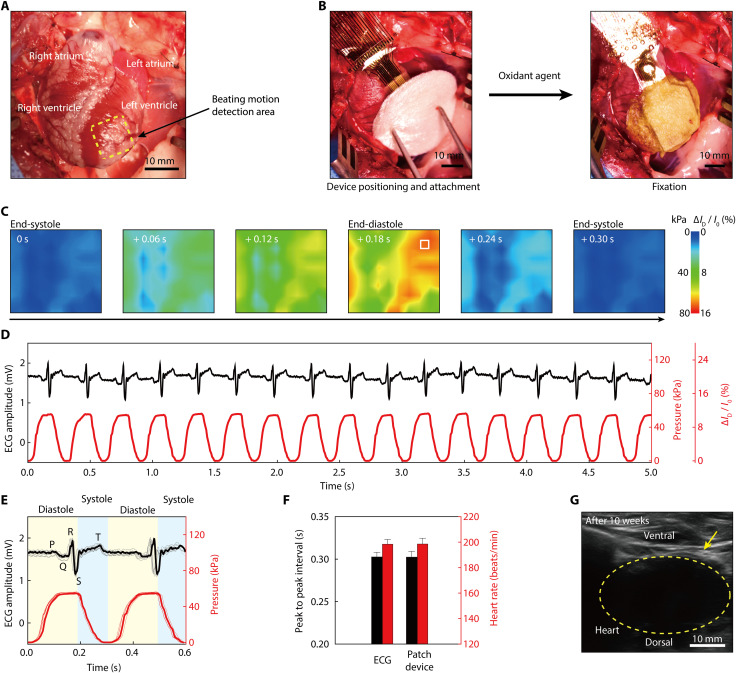
Fig. 5. Real-time monitoring of cardiac beating motion in a live rabbit model.
(A) Photograph of a live rabbit heart before the attachment of the device platform. Four chambers of this heart are shown in the photograph. The yellow dashed box indicates the site for the motion detection area using this patch-type device. (B) Photographs of the attachment process. The device patch was attached to the LV epicardium by covering an Ag-CA-Ca2+ adhesive. (C) Spatiotemporal color maps of epicardial pressure distribution measured using this device platform during a single cardiac cycle of a normal anesthetized rabbit. (D) Real-time detection trace of epicardial pressures (red line) using a pressure-sensitive transistor in the device platform [indicated by the white box at the end-diastole 2D map of (C)], in comparison to the surface ECG trace (black line). (E) Overlapped traces of epicardial pressures and the surface ECG, distinguishing the diastole and systole phases of a rabbit’s heart. (F) Comparison of heart rates and the peak-to-peak interval derived from the pressure sensing and the surface ECG. (G) Ultrasound image of the patch-type device platform attached to the epicardium of a rabbit’s heart for 10 weeks.

