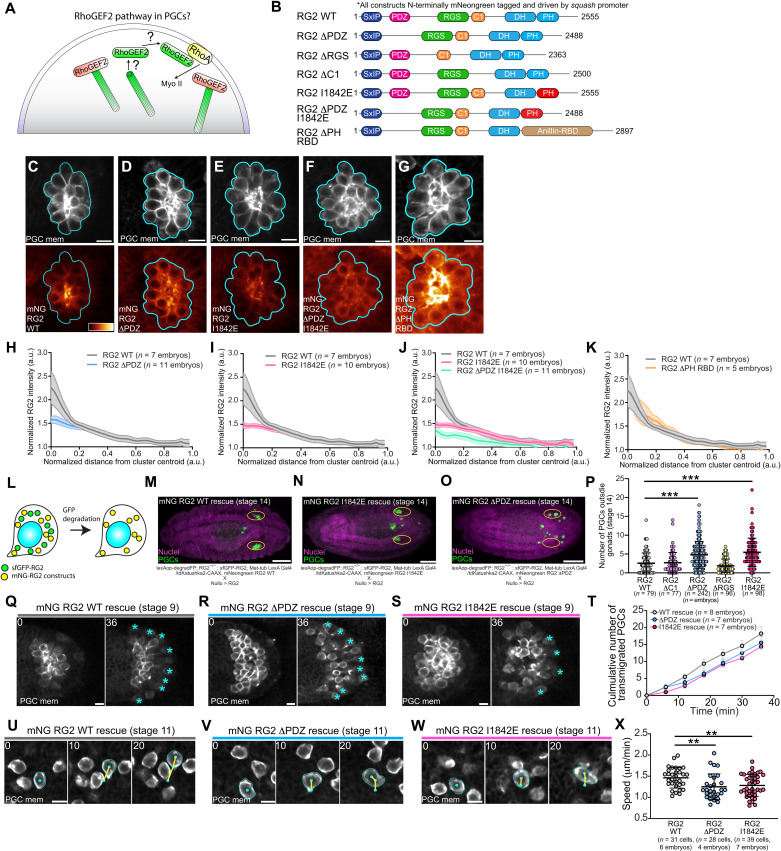
Fig. 6. RhoGEF2 PDZ and PH domains are necessary for polarity and migration.
(A) Unknown RhoGEF2 pathway in PGCs. (B) Schematic of RhoGEF2 protein domains and constructs created based on domain truncations and mutations. All constructs are driven by a ubiquitous squash (myosin II regulatory light chain) promoter and are N-terminally tagged with mNeongreen. (C to G) Representative two-photon image of a central plane from PGC clusters expressing the indicated mNeongreen RhoGEF2 transgene and tdKatushka2-CAAX (PGC membrane marker). mNeongreen-RhoGEF2 transgenes are pseudo-colored with the color bar in (C) and are scaled to the same intensity range. Cyan outlines the perimeter of the cluster. Scale bars, 10 μm. (H to K) Quantification of the indicated mNeongreen RhoGEF2 transgene intensity relative to distance from cluster centroid versus WT. Error bars are SEM. (L) Experimental scheme to assess domain-specific requirements of RhoGEF2. (M to O) Representative immunofluorescence images of stage 14 embryos under the indicated rescue conditions. Genotypes are stated below. Yellow ovals mark the gonads. Scale bars, 100 μm. (P, T, and X) Quantification of the number of PGCs outside gonads (P), transmigrated PGCs over time (T), or mean speed (X) under indicated rescue conditions. Error bars are SD in (P) and (X) and SEM in (T). (Q to S and U to W) Two-photon time-lapse imaging of representative PGC clusters expressing tdKatushka2-CAAX (PGC membrane marker) dispersing (Q to S) or individual PGCs migrating to the mesoderm (U to W) under the indicated rescue conditions. Cyan asterisks mark transmigrated PGCs in (Q) to (S), while cyan outlines cell membranes, cyan dots track nuclei, and yellow lines are cell tracks in (U) to (W). Scale bars, 10 μm. Times are in minutes. Statistical comparisons are pairwise from a Mann-Whitney test in (P) and (X). **P < 0.01 and ***P < 0.001.

