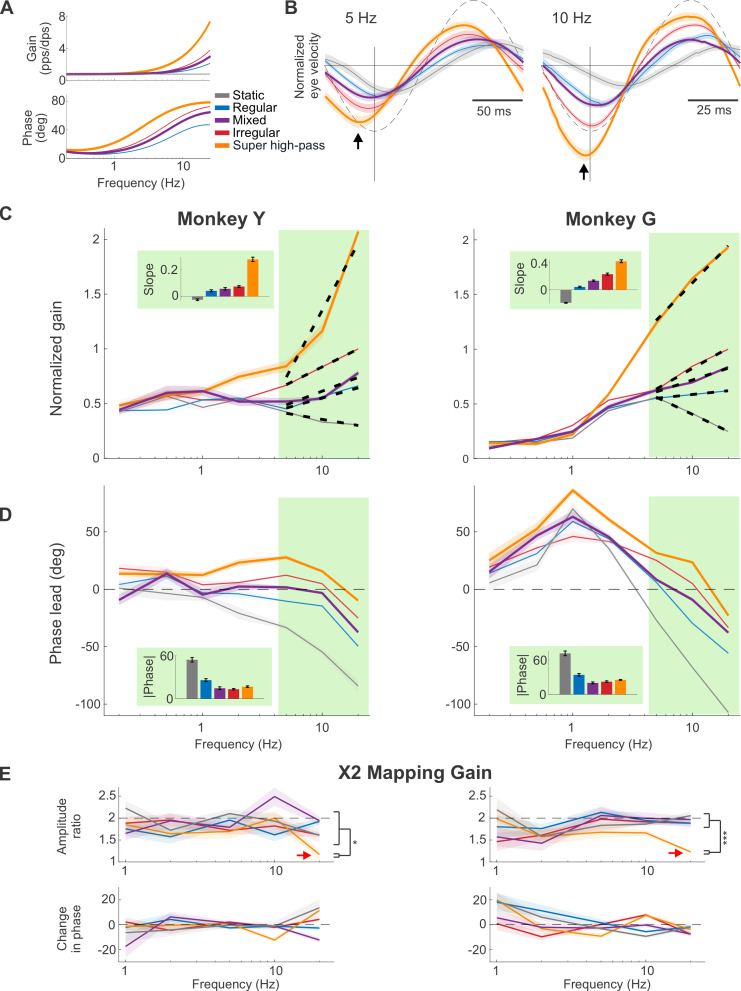
Fig 3. VOR performance is directly impacted by the response dynamics of the prosthesis mapping and the biomimetic mappings (i.e., regular, mixed, and irregular) resulted in the most accurate timing.
(A) The transfer functions of the additional mappings to explore the high-pass tuning parameter space: the super high-pass mapping (yellow), which shows an even higher increase in gain and phase lead than normal irregular afferents do, and the mixed mapping (purple), which was designed to represent the combined responses of regular and irregular afferents. (B) Example traces of the normalized evoked eye movements in 1 monkey at 5 and 10 Hz, again normalized to the maximum velocity evoked by the irregular mapping as in Fig 2. Results from Fig 2 are also plotted in thinner line for comparison. Dashed line indicated the simulated head velocity, scaled to facilitate phase response comparison. The vertical black lines indicate the maximum of the virtual head movement stimulus for comparison with the evoked eye velocity. The black arrows denote the peaks of the response from the super high-pass mapping, which showed larger phase lead than the other mappings. (C and D) Similar plots to (B) and (C) of Fig 2, respectively, with the addition of the data from the 2 new mappings. (E) Quantification of the VOR responses after doubling the overall mapping gains (i.e., 2× mapping gains; see Materials and methods). Top row shows the amplitude ratio of the evoked eye velocity of Monkey Y (left) and Monkey G (right) after doubling mapping gains for each of our 5 conditions (i.e., the velocity evoked by the 2× mapping/the velocity evoked by the original 1× mapping). The red arrows point to the ratio from super high-pass mapping at 20 Hz, which is significantly lower than other mappings and indicative of response saturation. Bottom row shows the change in phase after doubling the overall mapping gains. For both monkeys, the changes are generally not significant, with some significant but small (<13 deg) changes (p < 0.05, Bonferroni corrected). Data underlying this figure can be found at https://doi.org/10.5281/zenodo.6338639.

