. 2022 Sep 1;11:e77775. doi: 10.7554/eLife.77775

Figure 1. Genetic basis of neurotransmission in the zebrafish posterior-lateral line.

(A) Cartoon drawing of 5 dpf zebrafish larva with the posterior lateral line (LL) highlighted. The LL is made up of clusters of hair cell clusters called neuromasts (green dots). Neuromasts are innervated by neurons that project from the posterior LL ganglion (pLLg). (B–C) Side view (B) and top-down view (C) of neuromast from Tg[myo6b:memGCaMP6s]idc1 fish where the hair-cell membrane is labeled. White dotted line demarcates a single hair cell in each image. (D-D’) Cartoon schematic of a side view of a hair cell. At the apex is the mechanosensory hair bundle. The primary pathway of entry of neomycin, gentamicin, and FM 4–64 is through mechanotransduction channels in the mechanosensory hair bundle. At the base of the hair cell is the ribbon synapse. The presynapse or ribbon (magenta) is surrounded by synaptic vesicles (SV, white circles). When mechanotransduction channels are activated, an influx of cations including calcium enters the hair bundle. Hair bundle activation leads to opening of Cav1.3 voltage-gated calcium channels (blue) and presynaptic calcium influx. The calcium sensor Otoferlin (orange) facilitates fusion by coupling calcium influx with the exocytosis of SVs and the release of glutamate onto the innervating postsynaptic afferent terminal (gray). (E-E’) The spatial patterns of the evoked calcium influx (GCaMP6s ΔF, indicated via the heatmaps) into sibling hair bundles (E’) compared to prestimulus (C). (F-F’) Average traces (F) and dot plots show that the average magnitude of apical (F’) ΔF/F GCaMP6s signals in mechanosensory hair bundles is not different in cav1.3a-/- and otofb-/- mutants compared to siblings. (G-G’) The spatial patterns of the evoked calcium influx (GCaMP6s ΔF, indicated via the heatmaps) at wildtype presynapses (G’) compared to prestimulus (G). (H-H’) Average traces (H) and dot plots show that the average magnitude of presynaptic (H’) ΔF/F GCaMP6s signals is absent in cav1.3a-/- but unaltered in otofb-/- mutants compared to siblings. (I-I’) The spatial patterns of evoked exocytosis (SypHy ΔF, indicated via the heatmaps) at sibling presynapses (I’) compared to prestimulus (I). (J-J’) Averaged traces (J) and dot plots show that presynaptic (J’) ΔF/F SypHy signals are absent in cav1.3a-/- and in otofb-/- mutants. The fluid-jet stimulus depicted as a gray box in F, H, and J. Each point in the dot plots represents one neuromast. All measurements were performed in mature neuromasts at 5–6 dpf on 3 animals and 9 neuromasts per genotype. Error bars: SEM. A one-way AVOVA with a Dunnett’s correction for multiple tests was used in F’ and J’, and a Kruskal-Wallis test with a Dunn’s correction for multiple tests was used in H’. ** p<0.01, **** p<0.0001. Scale bar = 5 µm.

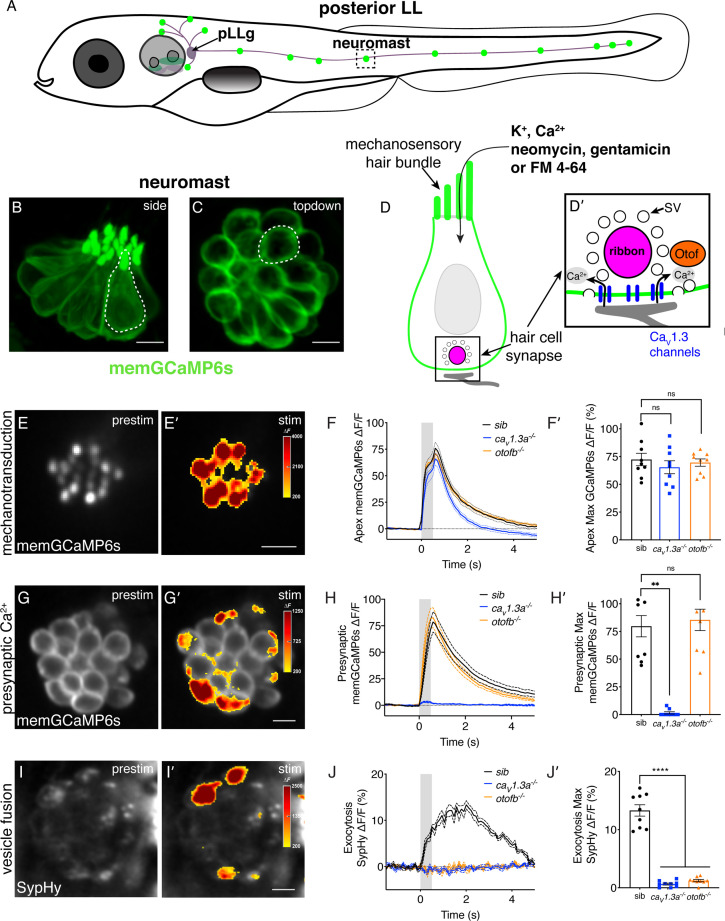
Figure 1—source data 1. Mean numbers and statistics for functional analyses.

Figure 1.

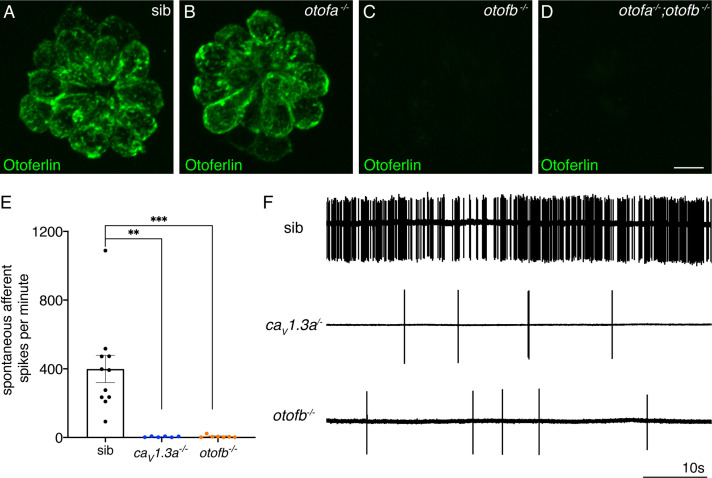
Figure 1—figure supplement 1. Spontaneous postsynaptic afferent activity is absent in cav1.3a mutant and otofb mutants.

Figure 1—figure supplement 1.

(A–D) Hair cells in neuromasts of wildtype (A), otofa-/- (B), otofb-/- (C), and otofa-/-/otofb-/- mutants (D) immunostained for Otoferlin. Loss of Otofb is sufficient to eliminate Otoferlin in lateral line neuromasts (C). (E) Average dot plots of spontaneous afferent spikes per minute recorded from posterior lateral line ganglion cell bodies in cav1.3a-/- (blue) and otofb-/- (orange) mutants or siblings (black) show that spontaneous afferent activity in both mutants is essentially absent. (F) Representative example traces of 60 second loose-patch recordings of spontaneous afferent spiking activity in sibling, cav1.3a-/- and otofb-/- mutants. Each point in the dot plot in E represents a recording from one afferent neuron. A minimum of 6 animals at 5–6 dpf were examined per group. Error bars: SEM. A Kruskal-Wallis test with a Dunn’s correction for multiple comparisons was used in E. ** p<0.01, *** p<0.001. Scale bar = 5 µm.
Figure 1—figure supplement 1—source data 1. Mean numbers and statistics for afferent spikes.

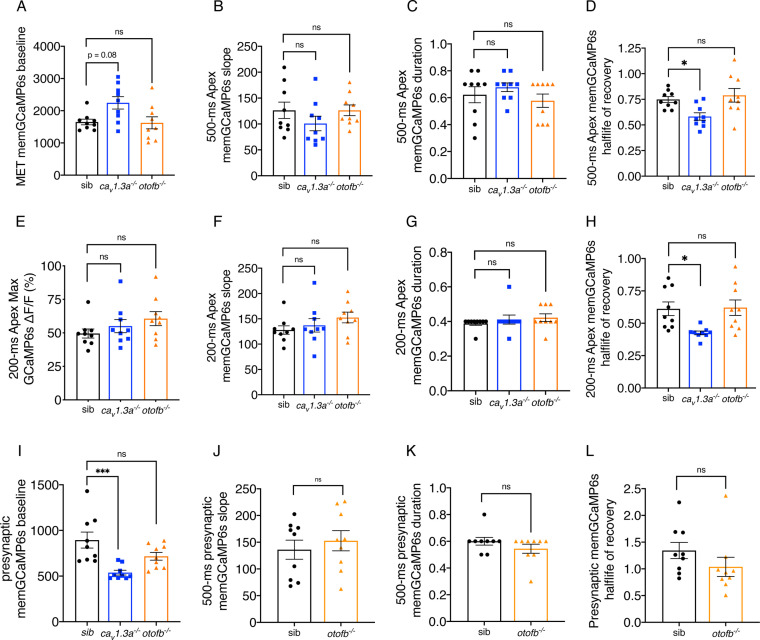
Figure 1—figure supplement 2. Further characterization of memGCaMP6s responses in cav1.3a and otofb mutants.

Figure 1—figure supplement 2.

(A) Resting memGCaMP6s intensity in apical hair bundles trends higher in cav1.3a-/- mutants but is similar to controls in otofb-/- mutants. (B–D) In response to a 500 ms stimulus, the slope (B) and duration (C) of the GCaMP6s response are not different compared to sibling controls. When fitted with an exponential decay, on average, the half-life of the signal to reach baseline after the 500 ms stimulus is faster in cav1.3a-/- mutants but similar to controls in otofb-/- mutants (D). (E–H) In response to a 200 ms stimulus, the average magnitude of apical ΔF/F GCaMP6s signals in mechanosensory hair bundles is not different in cav1.3a-/- and otofb-/- mutants compared to siblings (E). The slope (F) and duration (G) of the GCaMP6s response are also no different compared to sibling controls. When fitted with an exponential decay, on average, the half-life of the signal to reach baseline after the 200 ms stimulus is faster in cav1.3a-/- mutants but similar to controls in otofb-/- mutants (D). (I) Resting memGCaMP6s intensity at the base or presynaptic region is lower in cav1.3a-/- mutants but similar to controls in otofb-/- mutants. (J–L) In response to a 500 ms stimulus, the slope (J), duration (L) and the half-life of the decay (L) are unchanged in otofb-/- mutants compared to controls. No caV1.3a mutant data is included in J-L due to lack of presynaptic responses. For GCaMP6s measurements 3 animals and 9 neuromasts were examined per genotype. A Kruskal-Wallis test with a Dunn’s correction for multiple comparisons was used in A, C, E, and G. A one-way ANOVA with a Dunnett’s correction for multiple comparisons was used in B, D, F, H-I. An unpaired t-test was used in J-K. A Mann-Whitney test was used in L. * p<0.05, ***p<0.001.
Figure 1—figure supplement 2—source data 1. Mean numbers and statistics for functional analyses.