. 2022 Sep 1;11:e77775. doi: 10.7554/eLife.77775

Figure 2. Chronic loss of neurotransmission protects hair cells from the ototoxin neomycin.

(A-A’) Hair cells in siblings before (A) and after a 30-min treatment with 75 µM neomycin (A’). GCaMP6s outlines hair cells. The presence of FM 4–64 in hair cells reveals surviving cells (A’). (B-C’) After a 30-min treatment with 75 µM neomycin GCaMP6s and FM 4–64 more surviving hair cells are found in cav1.3a-/- (B), and otofb-/- (C) mutants. (D–E) A higher percentage of CaV1.3- and Otof-deficient hair cells survive a 30 min treatment with three different neomycin concentrations (75, 100, and 200 µM) compared to sibling controls. For quantification in D-E, neuromasts were examined at 5 or 6 dpf immediately after washout of neomycin solution and application of FM 4–64. (F) Percentage of hair cells per neuromast surviving is not altered when hair cells in wildtype larvae are co-incubated with 0.1% DMSO (control), 10 µM isradipine, or 2.5 µM Dynole 34–2 during the 30-min 100 µM neomycin treatment. (G–H) When wildtype hair cells are incubated with 10 µM isradipine or 2.5 µM Dynole 34–2 for 24 hr (G, 4 to 5 dpf) or for 48 hr (H, 3 to 5 dpf) prior to neomycin treatment significantly more hair cells survive compared to DMSO controls. Each point in the dot plots in D-H represents one neuromast. A minimum of five animals were examined per treatment group. Error bars: SEM. For comparisons, a two-way ANOVA with a Sidak’s correction for multiple comparisons was used in D-E. A one-way AVOVA with a Dunnett’s correction for multiple comparisons was used in F, G and H. * p<0.05, ** p<0.01, *** p<0.001. Scale bar = 5 µm.

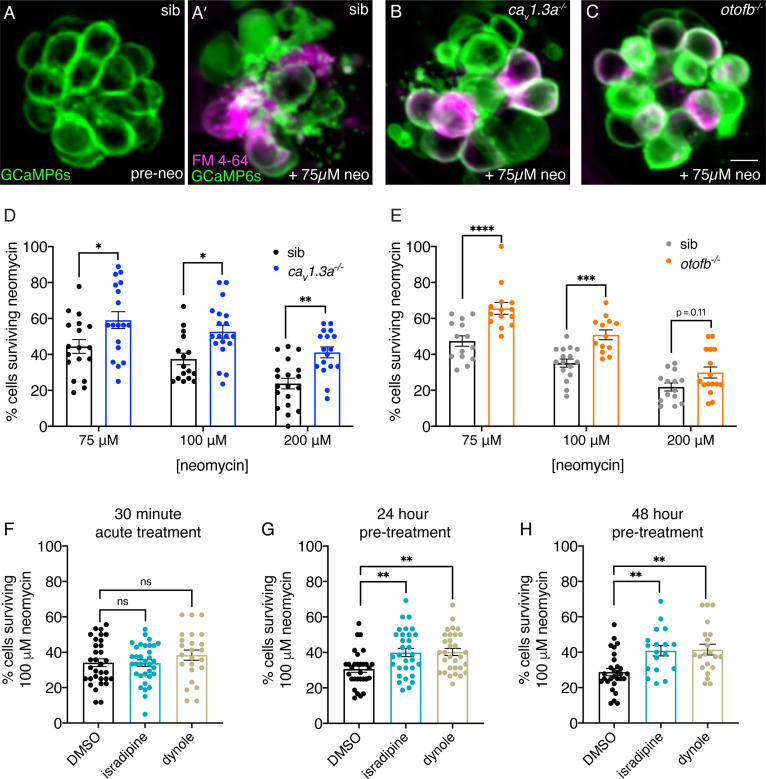
Figure 2—source data 1. Mean numbers and statistics for ototoxicity analyses.

Figure 2.

Figure 2—figure supplement 1. Treatment with 2.5 µM Dynole 34–2 reduces the frequency of afferent spiking and does not affect mechanotransduction or presynaptic calcium influx.

Figure 2—figure supplement 1.

(A–B) Average dot plots of evoked MET (A–B) and presynaptic (C–D) calcium influx (GCaMP6s ΔF/F) in wildtype neuromasts before and after a 10-min mock treatment in 0.1% DMSO (A) or a 10-min incubation in 2.5 µM Dynole 34–2 (B). These data show that Dynole 34–2 treatment does not affect calcium influx. (E–F) Average dot plots of spontaneous afferent spikes/min before (solid circles) and after (empty circles) a 10-min mock treatment in 0.1% DMSO (E) or a 10 min incubation in 2.5 µM Dynole 34–2 (F). These plots show that Dynole 34–2 significantly reduces afferent spiking activity in spikes/min. Each point in the dot plots represents one neuromast (A–D) or one afferent neuron (E–F). A minimum of four animals and eight neuromasts were examined in A-D at 5 dpf. Twelve animals were examined in C-D at 5–6 dpf. Error bars: SEM. For comparisons, a paired t-test (A–E) or a Wilcoxon test (F) were used. ** p<0.01.
Figure 2—figure supplement 1—source data 1. Mean numbers and statistics for functional analyses.
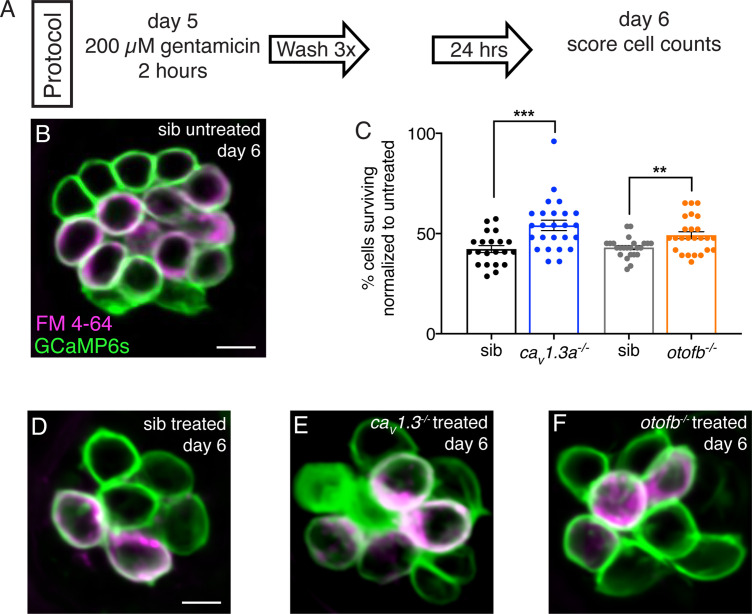
Figure 2—figure supplement 2. Cav1.3a and otofb mutants are resistant to gentamicin-induced cell death.

Figure 2—figure supplement 2.

(A) Outline of gentamicin treatment protocol. Mutants and siblings are treated with 200 µM gentamicin solution for 2 hr followed by three washes in embryo medium then allowed to recover for 24 hr. At 6 dpf, neuromasts are imaged and analyzed to obtain cell counts both in treated and untreated mutants and siblings. (B–C) Hair cells in a representative untreated wildtype neuromast (B) and gentamicin-treated wildtype (D), cav1.3a-/- (E), and otofb-/- (F) neuromasts at 6 dpf. Cells are stained with FM 4–64 to aid in cell counting and assessing cell maturity. GCaMP6s outlines hair cells. (C) Average dot plots of % of cells present in gentamicin-treated neuromasts normalized to the number of cells present in untreated neuromasts in cav1.3a-/- mutants (blue) and siblings (black) as well as otofb-/- mutants (orange) and siblings (grey) show that more cells survive in mutants than in siblings. Each dot in C represents one neuromast. A minimum of five animals were examined per treatment group. Error bars = SEM. For comparisons, a Mann-Whitney test was used to compare cav1.3a-/- mutants and siblings, and an unpaired t-test was used to compare otofb-/- mutants and siblings in D. ** p<0.01, *** p<0.001. Scale bar = 5 µm.
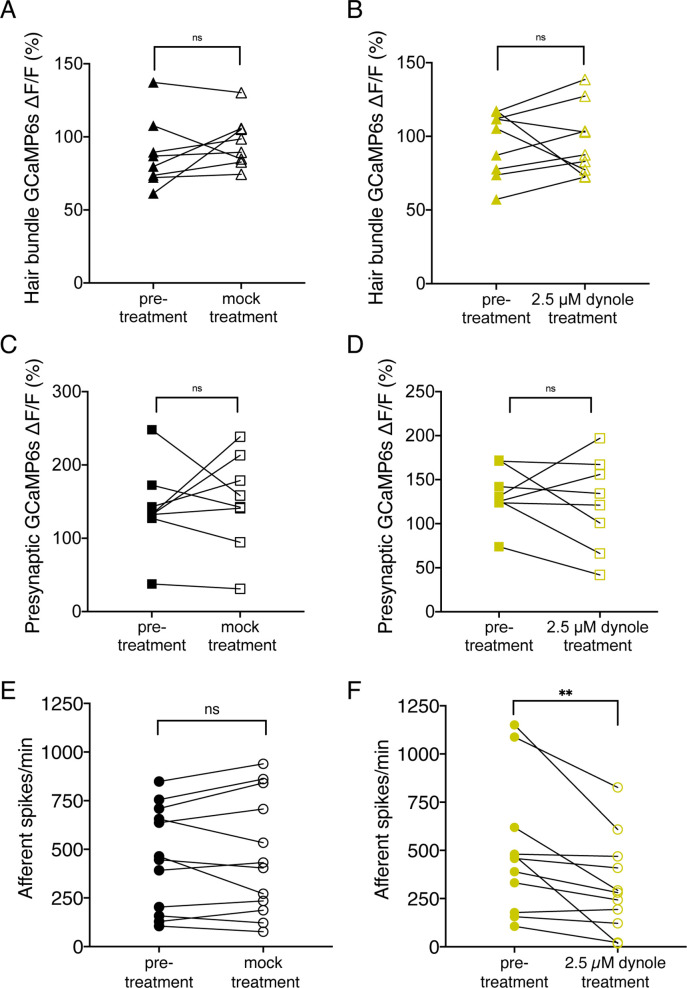
Figure 2—figure supplement 2—source data 1. Mean numbers and statistics for ototoxicity analyses.