. 2022 Sep 1;11:e77775. doi: 10.7554/eLife.77775

Figure 5. Cav1.3a and otofb mutants exhibit reduced mitochondrial oxidation and mitochondrial activity.

(A–C) Hair cells in a wildtype, cav1.3a-/- or otofb-/- neuromast (labeled with GCaMP6s) after 30-min incubation with 12.5 µM CellROX. (B) Average dots plots show that CellROX Orange fluorescence intensity is lower in cav1.3a-/- (blue) and otofb-/- (orange) mutants compared to wildtype siblings (black, gray). (E–G) Hair cells in a wildtype, cav1.3a-/- or otofb-/- neuromast (labeled with GCaMP6s) after a 15-min incubation with 5 µM MitoSOX. (H) Average dots plots show that MitoSOX Red fluorescence intensity is lower in cav1.3a-/- (blue) and otofb-/- (orange) mutants compared to wildtype siblings (black, gray). (I–K) Hair cells in a wildtype, cav1.3a-/- or otofb-/- neuromast (labeled with GCaMP6s) following a 30-min incubation with 10 nM TMRE. (L) Average dots plots show that the TMRE fluorescence intensity is reduced in both cav1.3a-/- (blue) and otofb-/- (orange) mutants compared to respective siblings (black, gray). Each dot in D, H, and L represents one neuromast. A minimum of 5 animals were examined at 6 dpf per treatment group. Error bars: SEM. For comparisons, an unpaired t-test was used. i in A-C are not hair cells but ionocytes labeled by CellROX. * p<0.05, ** p<0.01, *** p<0.001. Scale bar = 5 µm.

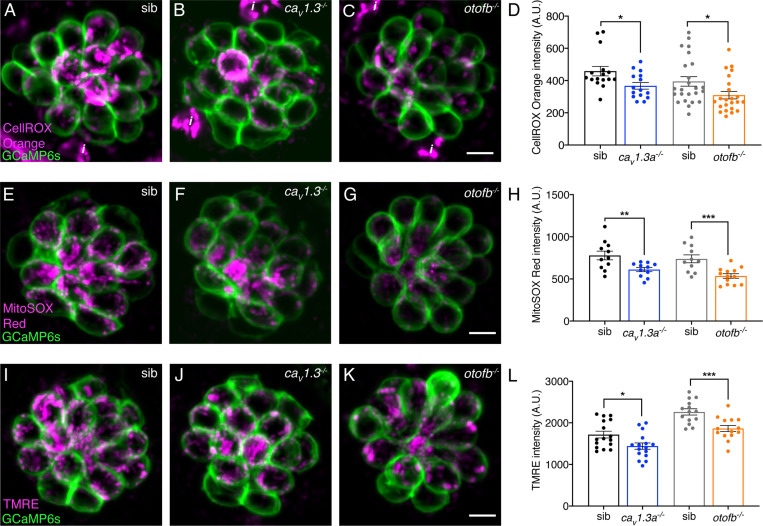
Figure 5—source data 1. Mean numbers and statistics for mitochondrial dye labeling.

Figure 5.

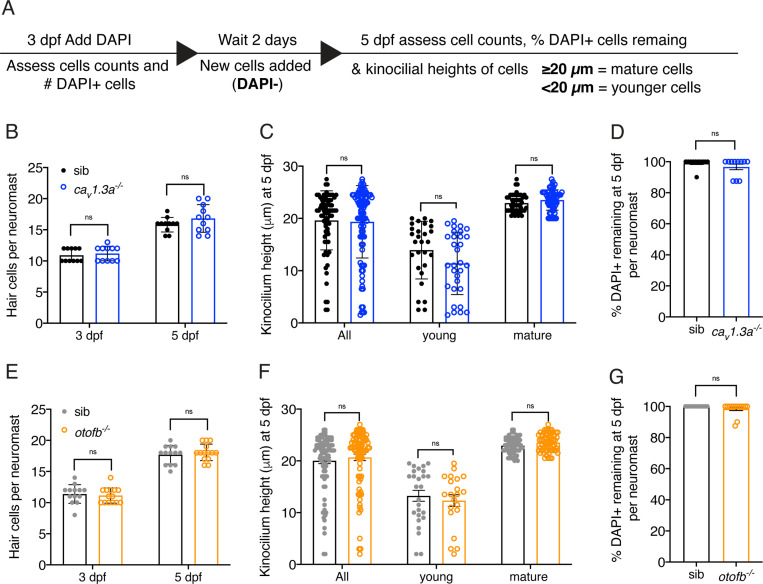
Figure 5—figure supplement 1. Hair cell development and turnover are largely normal in cav1.3a and otofb mutants.

Figure 5—figure supplement 1.

(A) Overview of procedure to label hair cells and monitor development and turnover overtime. (B, E) At both 3 and 5 dpf, caV1.3a-/- and otofb-/- mutants have the same number of hair cells per neuromast. A hair cell is defined as any hair cell with DAPI labeling. (C, F) Using the average height of the kinocilium (tallest part of the hair bundle) to assess the maturity of hair cells reveals no difference in caV1.3a-/- and otofb-/- mutants compared to controls. In mature neuromasts at 5 dpf, quantification reveals that the average height of the kinocilium in all hair cells, young hair cells and mature hair cells is not significantly different in caV1.3a-/- and otofb-/- mutants compared to controls. (D, G) After labeling mature hair cells with DAPI at 3 dpf, a high percentage of these DAPI + cells remain at 5 dpf in all genotypes. This indicates no significant loss of hair cells in caV1.3a-/- and otofb-/- mutants compared to controls. 8 neuromasts were examined per genotype in B-C and E-F. In D and G at least 11 neuromast were examined per genotype. Each dot in B, D, E, and G represents one neuromast. In C and F, each dot represents a single hair cell. Error bars: SEM. In D and G, a Mann-Whitney test was used, and in B-C and E-F a two-way ANOVA with a Sidak’s correction for multiple comparisons was used to compare differences.
Figure 5—figure supplement 1—source data 1. Mean numbers and statistics for cell stage and turnover.
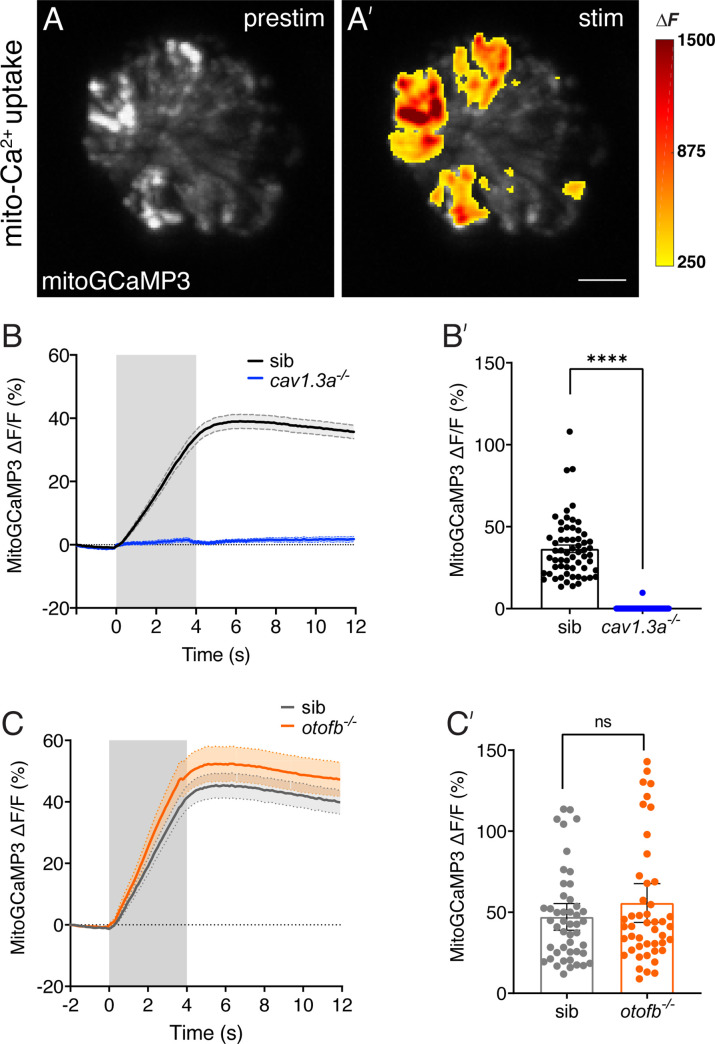
Figure 5—figure supplement 2. Evoked mitochondrial calcium uptake is normal in otofb mutants and absent in cav1.3a mutants.

Figure 5—figure supplement 2.

(A-A’) Hair cells from a wildtype neuromast expressing mitoGCaMP3 at 5 dpf before and during a 4 second fluid-jet stimulus. The heat map indicates spatial increases in mitochondrial calcium influx (mitoGCaMP3 ΔF) during stimulation (A’) compared to prestimulus (A). (B-B’) Average traces (B) and dot plot (B’) show that presynaptic mitoGCaMP3 signals are absent in cav1.3a-/- mutants. (C-C’) Average traces (C) and dot plot (C’) show that the average magnitude of presynaptic mitoGCaMP3 signals are not different in otofb-/- mutants compared to siblings. In B and C, the fluid-jet stimulus is depicted as a gray box. Each dot in B’ and C’ represents one hair cell. A minimum of 10 neuromasts and 5 animals were examined per treatment group. Error bars = SEM. For comparisons a Mann-Whitney test was used in B’ and C’. **** p<0.0001. Scale bar = 5 µm.
Figure 5—figure supplement 2—source data 1. Mean numbers and statistics for mitoGCaMP3 responses.
Figure 5—figure supplement 3. JC-1 shows a trend towards reduced mitochondrial activity in cav1.3a and otofb mutants.

Figure 5—figure supplement 3.

(A-A’) Hair cells in a wildtype neuromast after 5-min incubation with 1.5 µM of JC-1. JC-1 is a ratiometric indicator of mitochondrial membrane potential that shifts from green (A) to an aggregated red form (A’) in more active mitochondria. (B) Although the average dots plots show that JC-1 fluorescence intensity is lower in caV1.3a-/- (blue) and otofb-/- (orange) mutants compared to wildtype siblings (black), the reduction did not reach significance. Each dot represents one neuromast. A minimum of 18 neuromasts were examined at 6 dpf per group. Error bars: SEM. A one-way ANOVA with a Dunnett’s correction for multiple comparisons was used to compare between genotypes.
Figure 5—figure supplement 3—source data 1. Mean numbers and statistics for JC-1 labeling.