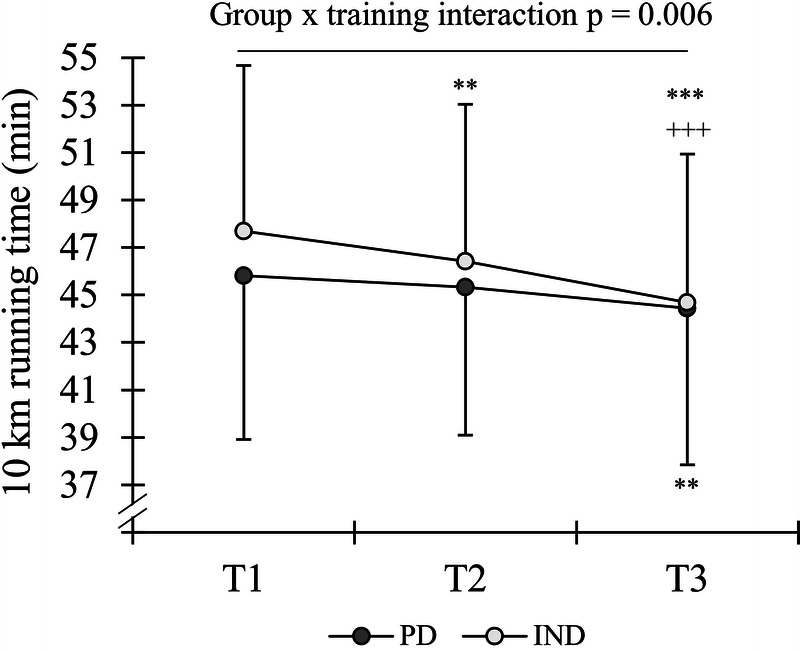
FIGURE 3.

Running time in the 10-km test before the VOL (T1), between the VOL and INT (T2), and after the INT (T3) periods in the PD and IND training groups. **P < 0.01, ***P < 0.001 within groups compared with T1 +++P < 0.001 within groups compared with T2.
